
Nothing much has changed in BTC since our update yesterday, BTC is still finding support on the anchored vWAP pulled from the 20th April lows and the range 0.66 fib pull and is still rejecting from the upper range POC highlighted in yesterdays report.
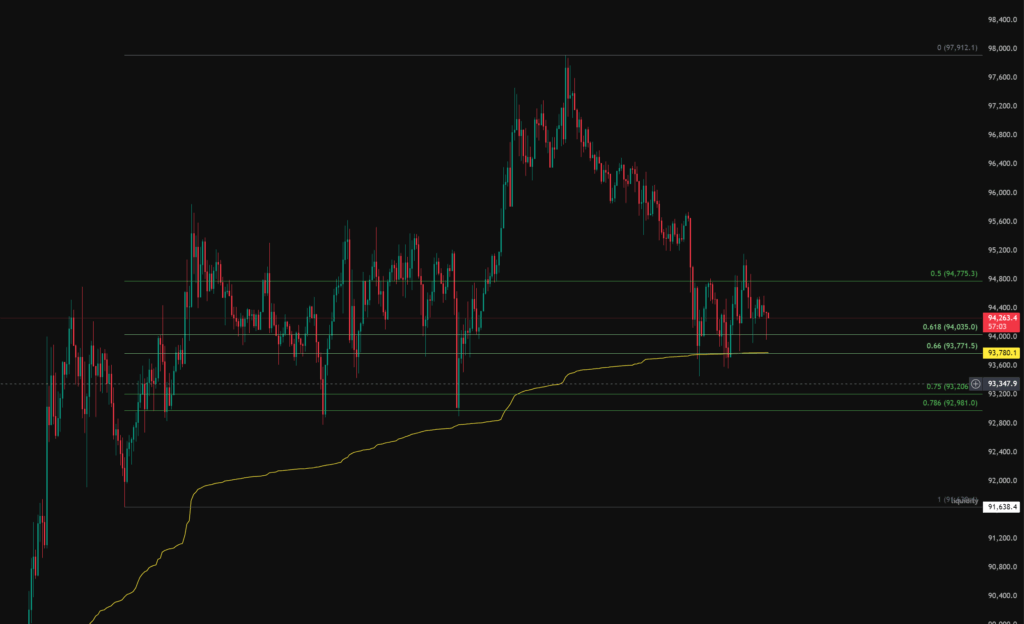
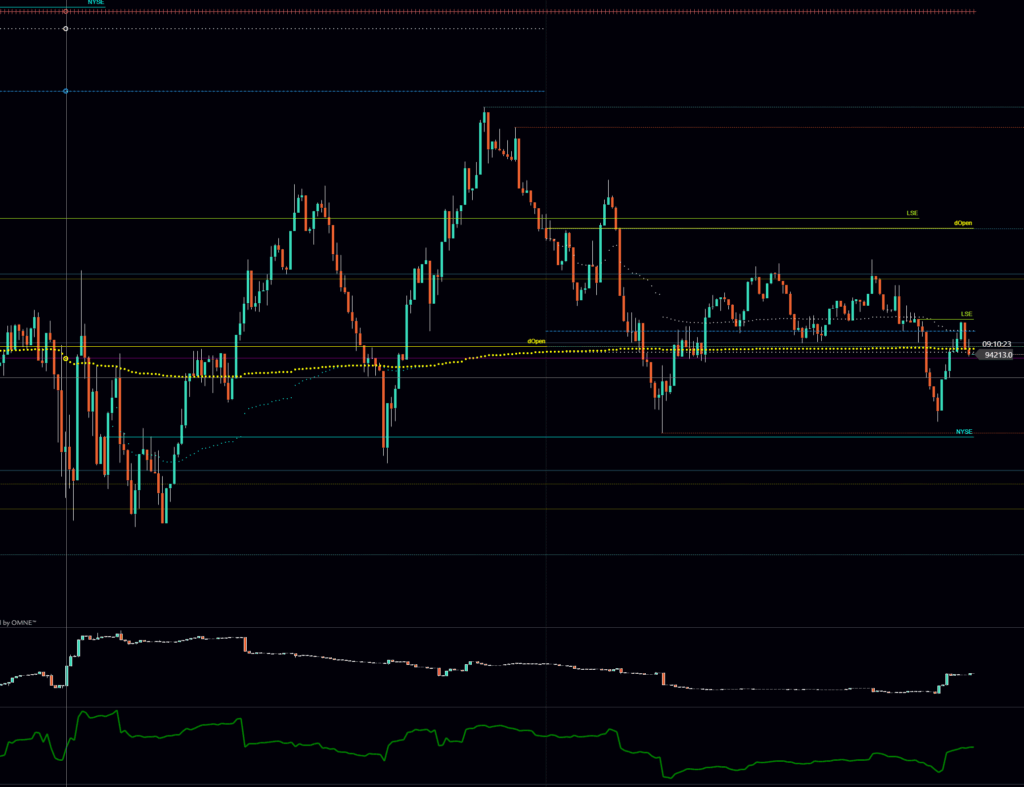
The below Bitcoin chart is a 5m chart showing the Bybit USD pair and we are seeing some bullish CVD forming which confirms sell orders are being absorbed by buy orders, although its worth noting the Open Interest is declining which shows positions closing.
Bitcoin Trading Plan and technical analysis for 6th May 2025.
The below BTC chart is plotted on the Bybit BTC/USD pair and shows local support and resistance zones.
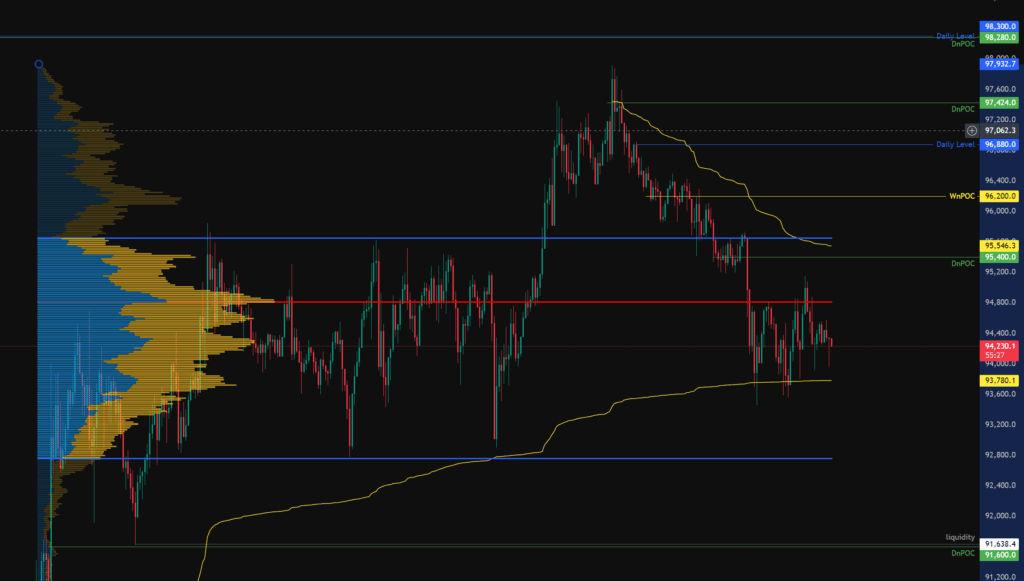
Todays levels of support where price may, or may not give a reaction are:
- 91,600 – dNPOC (Daily Naked Point of Control) in confluence with liquidity on the 24th April low.
- 85,100 to 83,600 – Zone containing wNPOC (Weekly Naked Point of Control), dNPOC (Daily Naked Point of Control) and Daily Level and 0.618 fib level.
- 82,500 – Monthly level, 0.66 fib and area of liquidity.
Todays levels of Resistance where price may, or may not give a reaction are:
- 95,400 – Daily Naked Point of Control, Local range Value area high, downtrend anchored vWAP.
- 98,300 – Daily Level, dNPOC (Daily Naked Point of Control), Liquidity of the local high and rejection of higher time frame POC.
News events to be aware of:
- None
The above levels are intended as areas of interest only, they are not in anyway financial advice and a valid entry trigger, stop loss placement and target needs to be considered before entering any position.