
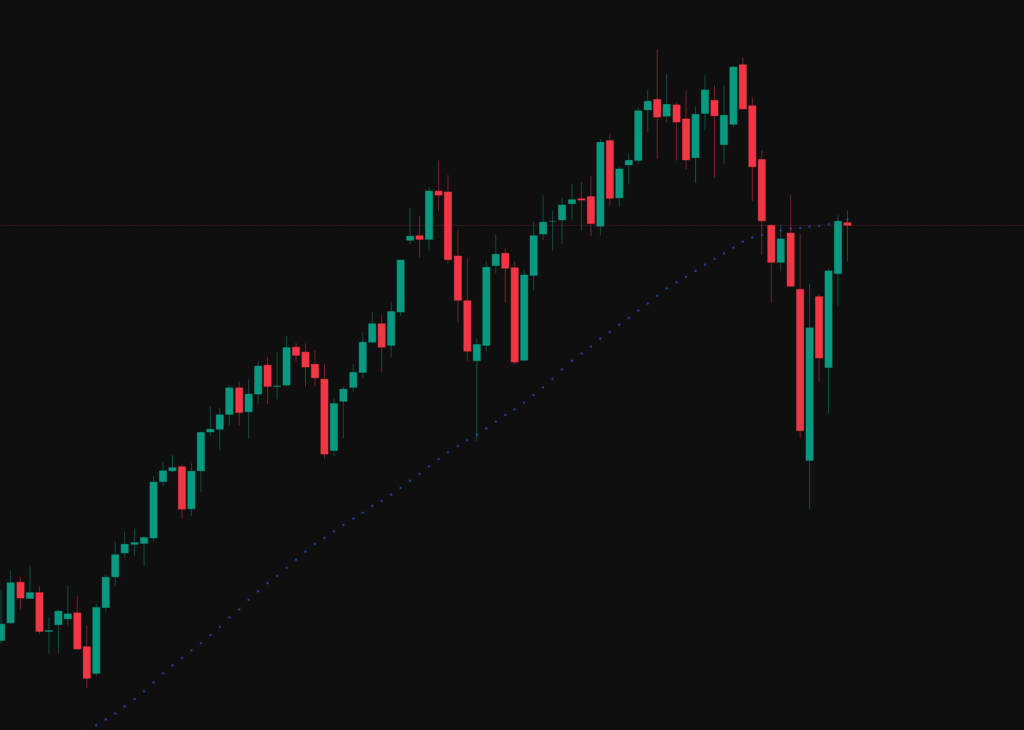
The below chart is a weekly view of the NQ futures, just like on our ES report the NQ is currently finding resistance at the 50SMA. For more upside we need to see this level claimed.
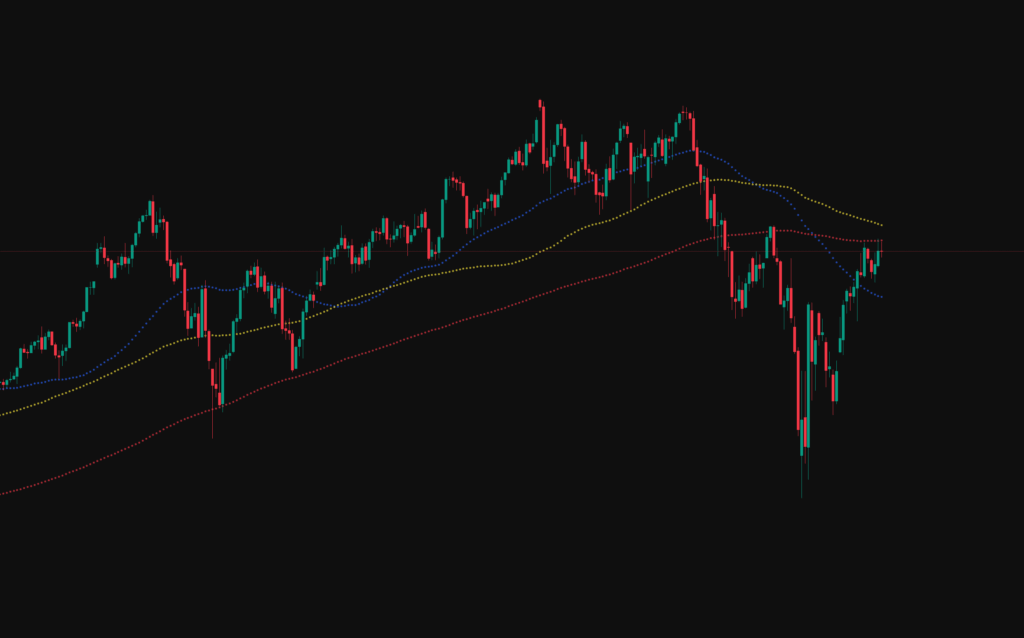
The below chart is a daily chart of the Nasdaq and we can see price is currently finding resistance at the 200SMA and just above we have the 100SMA which we would expect to also act as resistance.
Price is currently at the 0.66 fib retracement looking at a HTF chart, just like with the ES we need to be aware that the market could put in a lower high in this area moving on to make a new low.
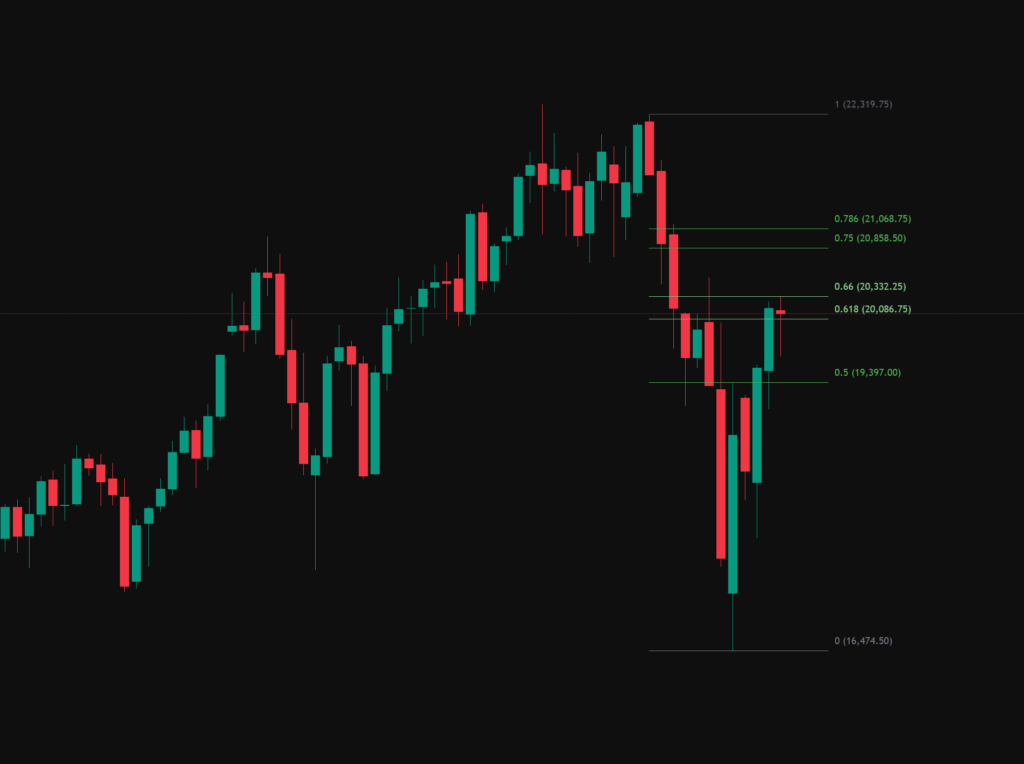
The weekly candle has also closed red, we need to be aware that this could be a reversal candle.
While the above charts point to possible downside in the coming weeks we need to be aware that market structure is currently bullish and there is nothing to suggest we are going to get a pull back, however as a trader we need to be aware of what the market may or may not do.
Trading Plan
The weekly and daily both opened with a gap up on news that a US/China trade deal has made progress. Robust risk management is recommended today as the markets may be volatile.
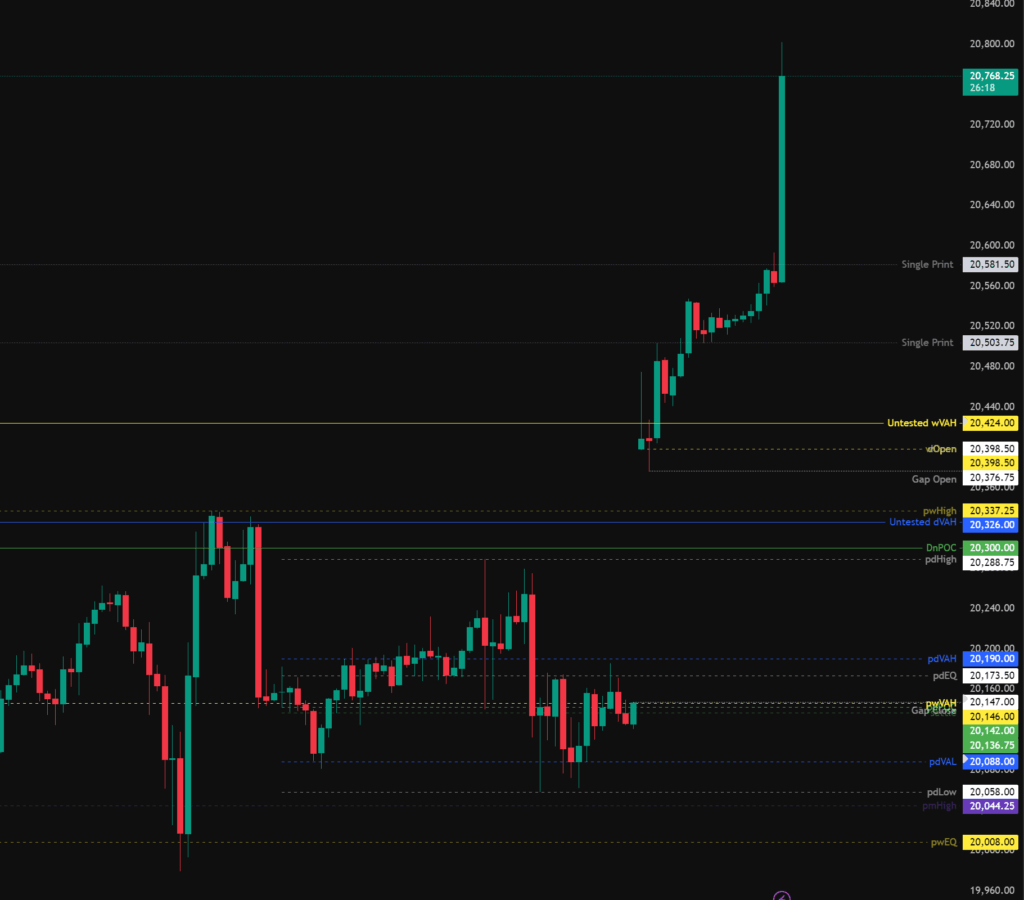
Todays levels of support for the Nasdaq where price may, or may not give a reaction are:
- 20,424 – Untested weekly value area high.
- 20,190 – pdVAH and 0.75 fib retracement
- 20,146 – Gap close, pwVAH, pdPOC, Settlement.
- 20,088 – pdVAL
- 20.058 – pdLow sweep & pmHigh backtest.
Todays levels of Resistance for the Nasdaq where price may, or may not give a reaction are:
- 20,101 – Untested daily value, liquidity.
- 21.200 – Weekly naked point of control.
- 21,347 – Untested daily value.
High Impact News events to be aware of:
- None.
The above levels are intended as areas of interest only, they are not in anyway financial advice and a valid entry trigger, stop loss placement and target needs to be considered before entering any position.