
Just like on the ES, yesterday Nasdaq opened London session with a bullish, impulsive candle on positive trade news talks being announced.
The Nasdaq chart and S&P 500 charts are closely correlated and today is no exception, the technical analysis between the charts is largely the same.
We are expecting volatility at 1:30 GMT due to high impact data releases so its always a good idea to be closed out of any trades or ensure risk management is tight.
Trading Plan
Today the daily open was in the upper quartile of the previous day price range, based on our statistical analysis we can expect yesterdays high to be traded above.
Yesterdays volume profile was a “P” shape, so we could expect the pdVAL to be defended if price trades to that level.
If both the ES/NQ are trading at this level at the same time we can use it as an extra confluence to take a trade if we see a reaction at the same time on both markets.
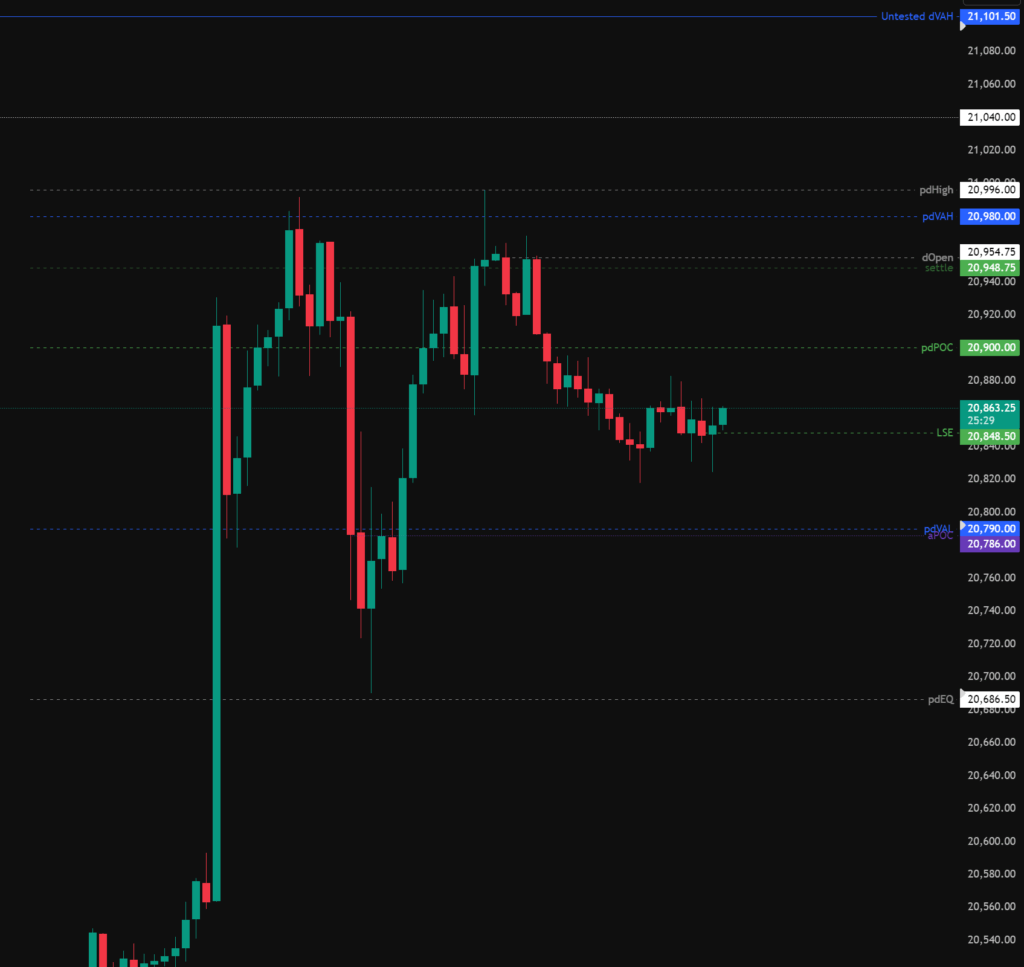
Todays levels of support for the Nasdaq where price may, or may not give a reaction are:
- 20,790 – pdVAL, aPoc and 0.66 fib retracement.
- 20,686 – Liquidity sweep in to pdEQ.
- 20,376 – pdLow sweep, gap top, aVWAP and wOpen.
Todays levels of Resistance for the Nasdaq where price may, or may not give a reaction are:
- 20,101 – Untested daily value, liquidity.
- 21.200 – Weekly naked point of control.
- 21,347 – Untested daily value.
High Impact News events to be aware of:
- 13:30 GMT – CPI / Core Inflation Rate.
The above levels are intended as areas of interest only, they are not in anyway financial advice and a valid entry trigger, stop loss placement and target needs to be considered before entering any position.