
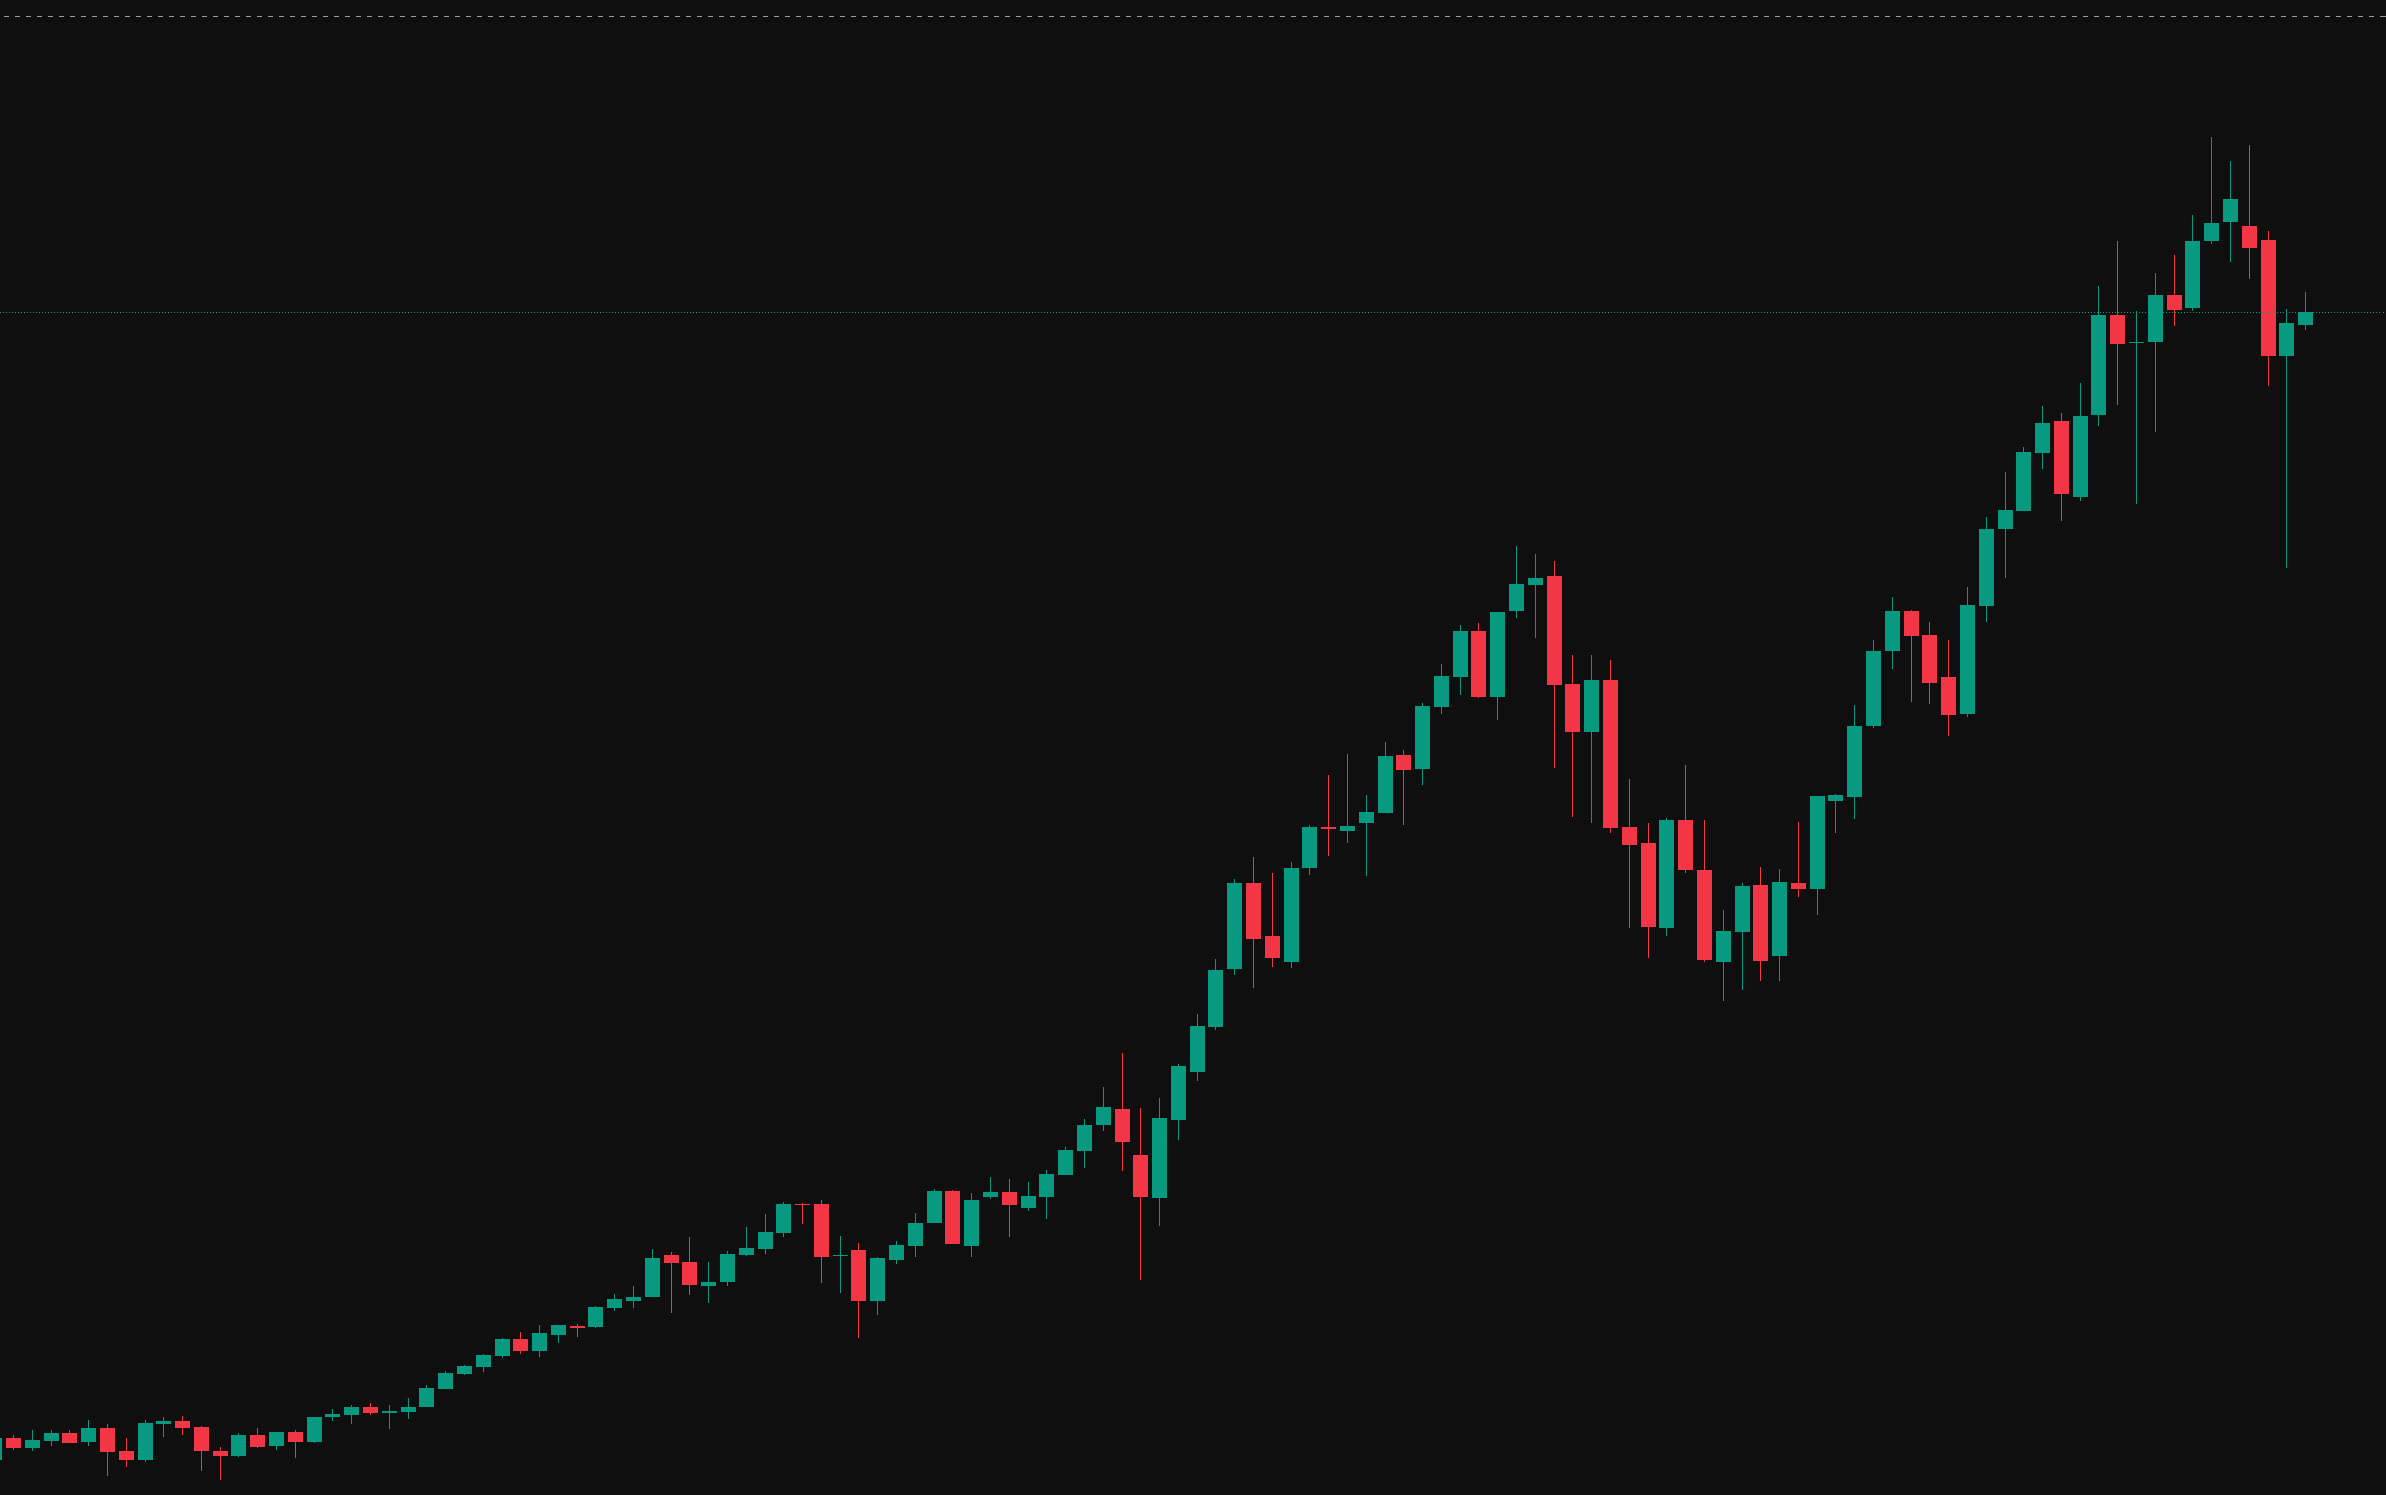
Yesterday Nasdaq saw a pullback, the below daily chart is starting to hit at potential weakness and something we need
Nasdaq (NQ) Technical Analysis
The Nasdaq. A powerhouse of innovation, a whirlwind of volatility. Trying to make sense of its daily dance can feel like navigating a complex maze. Fear not, fellow market enthusiasts! This is your daily compass, meticulously charting the Nasdaq’s technical terrain. We delve deep into the charts, illuminating potential pathways with precise technical indicators, key trendlines, and significant volume shifts. Cut through the daily noise and gain a focused perspective on where the Nasdaq might be heading. Whether you’re actively trading the tech titans or simply seeking a clearer understanding of market momentum, our daily technical snapshots provide the actionable insights you need to navigate the Nasdaq with greater clarity and conviction. Let’s decode the market together, one insightful analysis at a time.
Yesterdays NY session saw weakness locally on the Nasdaq and we saw a nice reaction from the $21,300 level given
The NQ had a much deeper pullback compared to the ES yesterday, this however was quickly bought back up during
As we enter in to a new trading week the Nasdaq is experiencing a pullback due to the US credit
As we come to the end of another trading week reviewing the daily chart on the NQ futures shown below
Yesterday we saw a ranging day in the NQ during the New York session, today price opened with a small
The Nasdaq continues to show strength, the daily chart below shows we are continuing to move up very bullishly and
Just like on the ES, yesterday Nasdaq opened London session with a bullish, impulsive candle on positive trade news talks
The below chart is a weekly view of the NQ futures, just like on our ES report the NQ is
Just like the ES, Nasdaq is still in bullish uptrend with no signs of weakness. Given the context, just like