
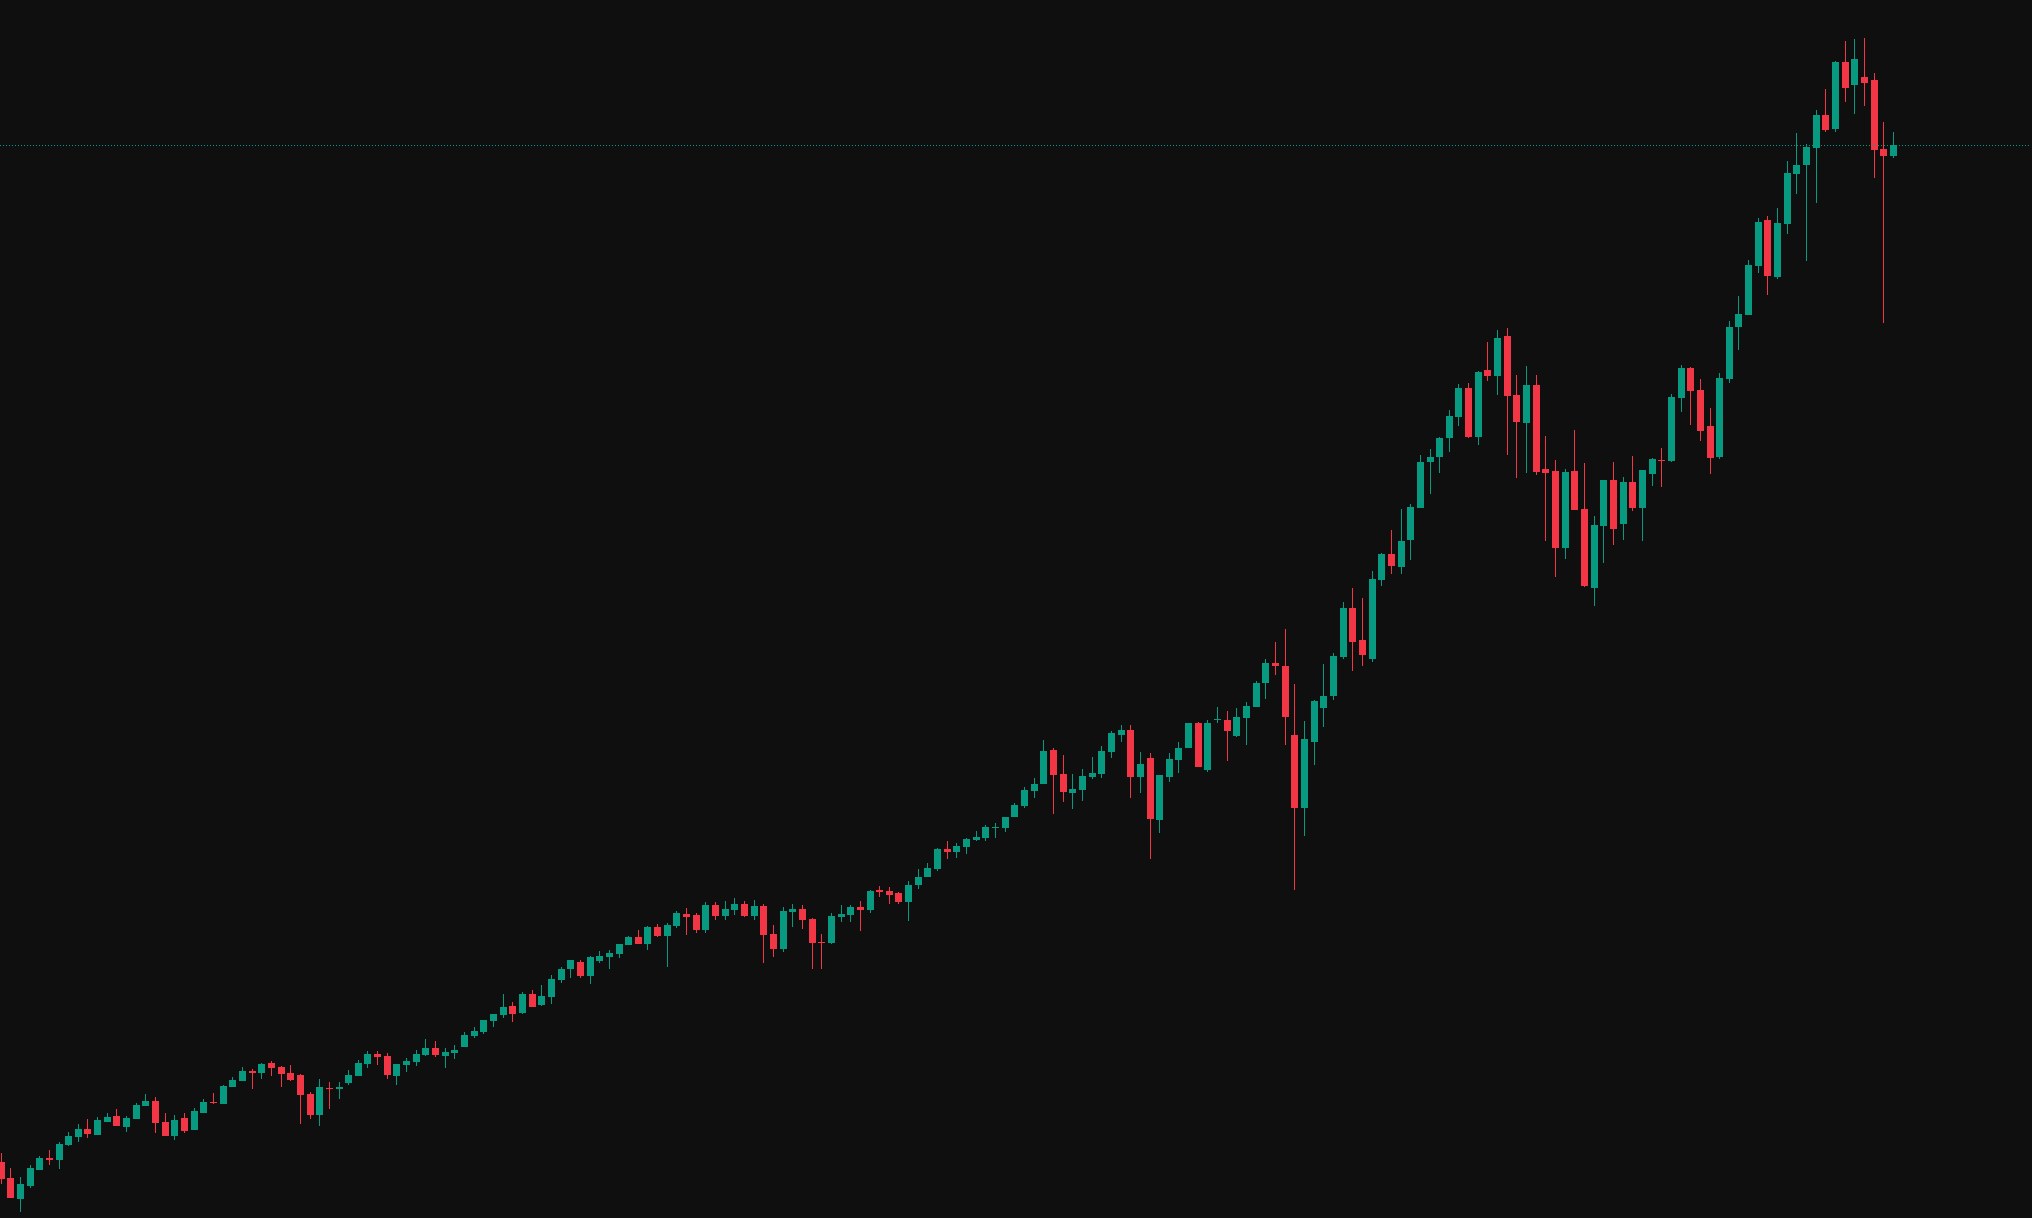
Yesterday saw a deeper pullback on the ES, looking at the below daily chart we can see a second daily
S&P 500 (ES) Technical Analysis
The S&P 500 (ES). The benchmark of American business, a barometer of global economic sentiment. 1 Its daily movements ripple across markets worldwide. Are you ready to understand the underlying forces driving these shifts? Here, we provide your daily blueprint, meticulously dissecting the S&P 500 through the lens of technical analysis. We move beyond fleeting headlines, focusing on the language of the charts – identifying critical patterns, analysing momentum shifts with key indicators, and pinpointing pivotal support and resistance zones. Whether you’re managing a portfolio, trading the index, or simply seeking a deeper grasp of market dynamics, our daily technical insights offer a clear and focused perspective. Equip yourself with the knowledge to interpret the S&P 500’s daily narrative and navigate the market with greater confidence. Let’s unravel the market’s story, one technical analysis at a time.
Yesterday saw a mainly rangebound day with gradual lower highs developing which is hinting at weakness locally and we have
In yesterdays ES technical analysis the market was in a downtrend during London due to the bearish news coming out
As we begin a new week we are starting with a local pullback on the ES on bearish news coming
The below chart is a daily view of the S&P 500 (ES), we can see the market is still clearly
Yesterday we saw an inside day on the ES, the NY session was rangebound with no large trending moves like
Yesterday was another trending day on ES with the market continuing to rally on positive news coming out of the
Yesterday opened with a large gap to the upside and we had a large bullish candle on London open due
As a new trading week begins I would like to start by taking a higher time look at the charts.
Taking a higher time frame view, we can see the ES is still in a bullish uptrend since the lows