
The realm of intraday trading is characterised by rapid price fluctuations and the constant interplay between buying and selling pressures. Within this dynamic environment, traders seek reliable tools and concepts to interpret market behaviour and formulate effective strategies. One such foundational concept is the Initial Balance (IB), a measure of the market’s activity during the crucial opening hour of a trading session. Understanding the nuances of the Initial Balance High (IBH) and the Initial Balance Low (IBL) can provide traders with valuable insights into potential intraday price movements and serve as integral components of various trading methodologies.
The below chart shows the Initial Balance at the start of the NY trading session on the Nasdaq. The blue box highlights the first hour of trading with the initial balance high and low being the highest and lowest traded price during this initial period.
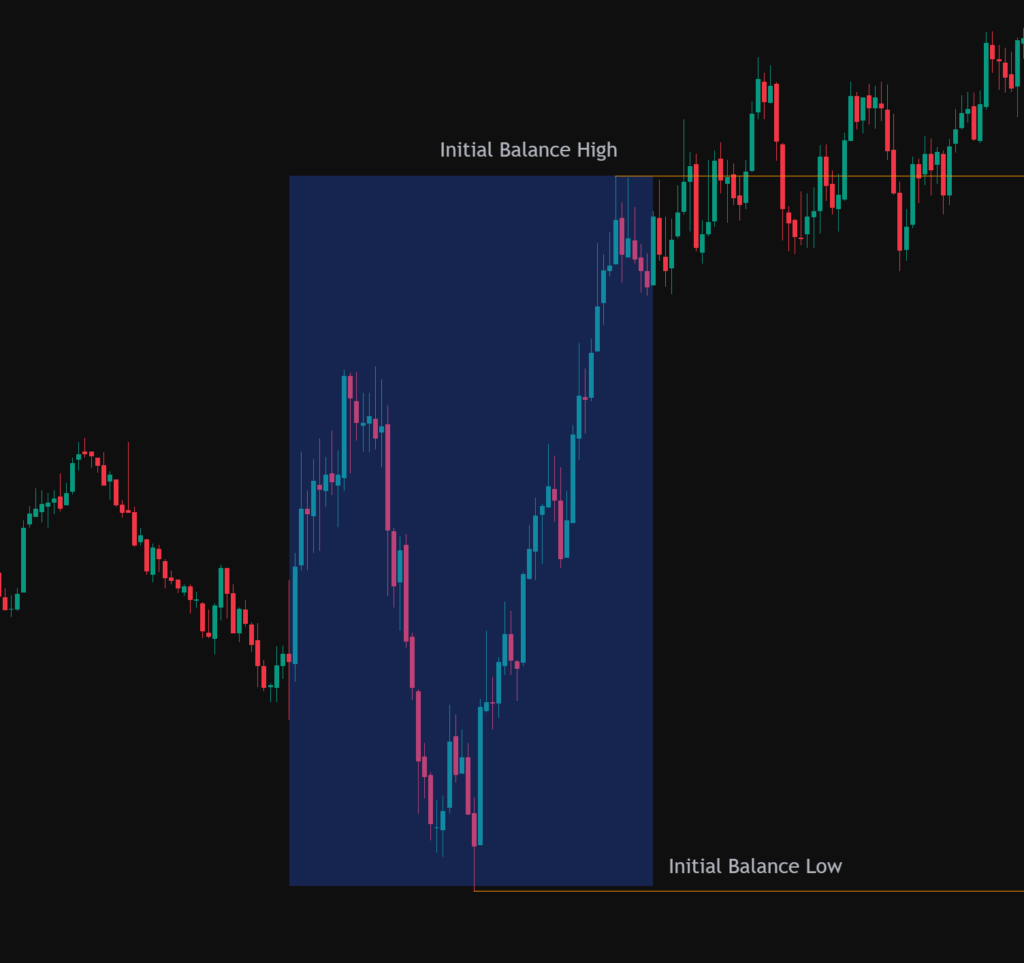
The Initial Balance (IB) is fundamentally defined as the price range that is established during the first hour of a trading session, typically commencing from the market’s opening bell. This initial period is considered significant as it often reflects the immediate reaction of market participants to overnight news and sets the tone for the trading day ahead. The upper boundary of this range, representing the highest price reached during the first hour, is known as the Initial Balance High (IBH). Conversely, the lower boundary, indicating the lowest price traded during the same initial hour, is termed the Initial Balance Low (IBL). While the traditional timeframe for the IB is the first hour of trading, it is important to note that this can be adapted based on the specific market and the trader’s objectives. For instance, some traders might focus on the first 15 or 30 minutes, while swing traders or longer-term investors might consider the initial balance over the first two days or even weeks. The concept of the Initial Balance was first popularised within the framework of Market Profile analysis, introduced by the renowned trader and author Peter Steidlmayer.
The Initial Balance, and consequently the IBH and IBL, hold considerable significance for traders as they provide an early snapshot of market sentiment and potential volatility for the trading day. The span between the IBH and IBL, known as the IB range, reflects the initial equilibrium established between buyers and sellers. The width of this range can offer valuable clues about the market’s conviction at the open. A narrow IB range often suggests a period of low initial conviction, implying that market participants are in close agreement about price. This lack of strong directional bias early in the session can frequently precede a phase of range expansion and the emergence of a trending market later in the day. The rationale behind this is that a tight initial range indicates that larger market participants might be waiting for a catalyst or further information before committing to significant positions, which can then trigger a substantial price movement. Conversely, a wide IB range typically indicates high initial volatility and potentially a day characterized by range-bound trading. A large initial balance suggests significant disagreement on price early in the session, with both buyers and sellers actively participating and establishing a broader equilibrium. In such scenarios, the price may oscillate within these established boundaries for a significant portion of the trading session. Beyond the range itself, the volume of trading activity within the IB period is also an important factor to consider. High volume during the formation of the IB might indicate strong interest and acceptance of prices at those levels, potentially reinforcing the likelihood of a range-bound session.
Conversely, a low volume IB might suggest less conviction behind the initial price action, increasing the probability of a trending session as larger participants might be absent initially. Combining the analysis of the IB range width and the volume traded provides a more comprehensive understanding of the underlying market sentiment and the potential for subsequent price movements.
Throughout the trading day, the IBH and IBL often function as dynamic levels of support and resistance. The IBH frequently acts as a resistance level, where selling pressure might emerge, potentially preventing further upward movement. A successful break above the IBH, however, can be interpreted as a sign of increasing bullish momentum. Conversely, the IBL often serves as a support level, where buying interest might materialise, halting price declines. A breach below the IBL could indicate growing bearish sentiment. It is crucial to recognise that these levels are not impenetrable barriers but rather zones where the probability of a price reaction is higher. The strength and reliability of these levels can be influenced by various factors, including the time of day, the prevailing overall market trend, and the presence of other significant support and resistance levels identified through different technical analysis methods. In certain market conditions, particularly following the formation of a wide IB range, the price might remain contained within the IBH and IBL for a substantial part of the trading session. This behaviour suggests a lack of clear directional conviction beyond the initial trading range, and in such instances, traders might consider employing strategies that capitalize on price reversals at these boundaries.
Traders integrate IBH and IBL into their strategies in various ways, depending on their trading style and the prevailing market conditions. One common approach is breakout trading, where traders look for opportunities to enter positions when the price moves decisively beyond either the IBH or the IBL. A break above the IBH is often seen as a signal to initiate long positions, anticipating further upward movement, while a break below the IBL might prompt traders to consider short positions, expecting continued downward momentum. When employing breakout strategies, it is essential to look for confirmation signals to increase the probability of a successful trade and avoid being caught in false breakouts. Such confirmation can come from increased trading volume accompanying the breakout, strong and decisive price action, or alignment with signals from other technical indicators. Entry techniques for breakout trades can vary; some traders might enter immediately upon the price breaking the IB level, while others prefer to wait for a pullback to retest the broken level as a new area of support (if IBH is broken) or resistance (if IBL is broken) before entering. To manage the risk associated with potential failed breakouts, traders often place stop-loss orders within the IB range, which would be triggered if the price reverses back into the initial balance after the breakout attempt. The underlying assumption of IB breakout strategies is that a break beyond the initial equilibrium signifies a shift in intraday market sentiment and the potential for a sustained move in the direction of the breakout. However, it’s important to acknowledge that the success rate of breakouts can vary, underscoring the need for robust confirmation and risk management.
Another strategic application of IBH and IBL lies in range bound trading, which is particularly relevant when the market exhibits a tendency to trade within the established initial balance. In such scenarios, traders might look to initiate long positions near the IBL with a profit target set near the IBH, and conversely, consider short positions near the IBH with a target near the IBL. The effectiveness of range-bound strategies is closely tied to the width of the IB range and the broader market context. Range bound trading is generally more suitable when a wider IB formation suggests initial indecision or a balanced market, where the price is likely to oscillate between the established high and low.
Beyond the immediate IB range, traders also utilise Initial Balance extensions to identify potential price targets or areas of interest following a breakout. These extensions are typically calculated by adding or subtracting multiples of the IB range to the IBH and IBL. For example, a 1.5x IB extension above the IBH would be calculated by taking the difference between the IBH and IBL (the IB range), multiplying it by 1.5, and adding this value to the IBH. Similarly, extensions can be calculated below the IBL. Traders might use these extension levels to set profit targets on breakout trades or to anticipate potential areas where the price might encounter further support or resistance. IB extensions can be particularly valuable on trending days that follow an initial breakout from the IB range.
The utility of IBH and IBL can be further enhanced by combining them with other technical analysis indicators. For instance, Volume Profile analysis can be used to identify high-volume nodes or value areas that coincide with the IBH or IBL. When an IB level aligns with a significant level on the Volume Profile, such as the Point of Control (the price with the highest traded volume) or the Value Area High/Low (the range where 68-70% of the volume traded), it can lend greater significance to that IB level, suggesting a higher probability of a price reaction. VWAP (Volume Weighted Average Price) is another indicator that traders often use in conjunction with IBH and IBL to gain further insight into intraday trends. Monitoring how the price interacts with the VWAP relative to the IB levels can provide additional context. Similarly, Moving Averages can be employed to confirm the direction of a potential breakout from the IB range or to identify dynamic support and resistance levels in proximity to the IBH or IBL. Combining the objective reference points of the initial balance with indicators that gauge momentum or trend strength can help traders filter out less reliable breakout signals and potentially improve the probability of successful trades.
Beyond the core concepts and strategies, there are more advanced considerations related to the initial balance. One such concept is that of failed breakouts. This occurs when the price momentarily moves beyond the IBH or IBL but then quickly reverses and closes back within the initial balance range. These failed breakout attempts can often present opportunities for reversal trades, as they might indicate a lack of sustained buying or selling interest beyond the IB levels. Another valuable consideration is the position of the daily open in relation to the initial balance. For example, if the market opens near the IBL and then price moves up to the IBH, it might suggest an underlying bullish sentiment for the session. Conversely, an opening near the IBH followed by a move down to the IBL could indicate bearish intent. An opening price within the IB range might suggest an initial acceptance of that price level and a higher likelihood of range-bound activity within the IBH and IBL. Understanding this relationship between the opening price and the initial balance can provide traders with early clues about the potential direction of the market for the remainder of the trading day. Furthermore, the initial balance is intrinsically linked to Market Profile concepts. The IB often forms within the previous day’s Value Area, and a breakout from the IB can potentially signal a move towards the next Value Area. The Point of Control (POC) from the Market Profile can also act as an attractor for price, and the position of the IB relative to the POC can offer insights into potential price targets or areas of congestion. Integrating the analysis of the initial balance with the broader framework of Market Profile provides a more holistic understanding of market structure and potential price movements based on both time and volume.
To illustrate the practical application of IBH and IBL, consider a few scenarios.
In Scenario 1: Narrow IB leading to a trend day, imagine a trading day where the price range during the first hour is exceptionally tight. This could suggest that there is a lack of strong buying or selling pressure immediately after the open. If, later in the session, the price breaks decisively above the IBH on significant volume, it might signal the beginning of a strong upward trend. Traders might then look to enter long positions, potentially using IB extensions as profit targets.
In Scenario 2: Wide IB leading to range bound trading, picture a day where the first hour of trading experiences considerable price volatility and high trading volume, resulting in a relatively wide IB range. This scenario might indicate that the market is in a state of equilibrium, with both buyers and sellers actively participating. Traders could then employ a range-bound strategy, looking to buy near the IBL and sell near the IBH throughout the day.
In Scenario 3: Breakout with volume confirmation, suppose that after the first hour, the price breaks above the IBH accompanied by a noticeable increase in trading volume. This volume confirmation strengthens the bullish signal, suggesting that the breakout is likely to be sustained. Traders might enter long positions on this breakout, placing a stop-loss order just below the IBH to manage risk. They could then target higher price levels, potentially using IB extensions or other resistance levels as guides.
Finally, in Scenario 4: Failed breakout and reversal, imagine a scenario where the price briefly dips below the IBL but then quickly reverses and closes back within the initial balance. This failed breakout could be interpreted as a sign of underlying buying support near the IBL. Traders might then look for opportunities to go long, anticipating a move back towards the IBH.
While the IBH and IBL offer numerous benefits as part of a trading strategy, it is also important to acknowledge their limitations and potential pitfalls. One common challenge is the occurrence of false breakouts, where the price briefly moves beyond an IB level but then reverses, potentially leading to losses if not managed properly. This is particularly true in volatile market conditions.
The effectiveness of IB-based strategies can also vary depending on the specific market being traded and the prevailing market conditions or day type. It is generally recommended that IBH and IBL should not be used as standalone trading signals but rather in conjunction with other forms of technical analysis and a comprehensive understanding of the market context. Furthermore, the traditional “first hour” timeframe for the IB might not be universally optimal for all markets or trading styles. Unexpected market-moving news or events that occur after the initial balance has formed can also significantly impact price action and potentially invalidate the relevance of the IB levels. Therefore, while IBH and IBL provide valuable reference points, traders must remain aware of their limitations and integrate them into a well-defined trading plan that includes sound risk management principles and considers the broader market environment.
In conclusion, the Initial Balance High (IBH) and Initial Balance Low (IBL) are fundamental concepts in intraday trading that offer valuable insights into the market’s opening dynamics. By understanding how these levels are established, their significance in gauging market sentiment and potential volatility, and their application within various trading strategies, traders can significantly enhance their ability to interpret early market behavior and identify potential trading opportunities. While IBH and IBL provide clear and objective reference points, their effective utilisation requires careful consideration of market context, confirmation from other technical analysis tools, and adherence to sound risk management practices. Mastering the initial balance can be a crucial step towards more informed and potentially profitable intraday trading.
| Market Type | Typical IB Timeframe |
| Equities | First hour of trading after market open |
| Futures | First hour of Regular Trading Hours (RTH) |
| Forex | First hour after new day (00:00 UTC), London Open (7:00-8:00 UTC), or Asian Session Range (00:00-7:00 UTC) |
| Swing/Longer-Term | First two days or first two weeks of the period |
| Strategy Type | Entry Rules | Stop-Loss Placement | Potential Targets |
| Breakout Trading | Buy above IBH, Sell below IBL | Inside IB range | IB extensions, next support/resistance |
| Range-Bound Trading | Buy near IBL, Sell near IBH | Outside IB range | Opposite IB level |
| Failed Breakout | Buy near IBL after failed break below, Sell near IBH after failed break above | Outside failed break | Opposite IB level |