
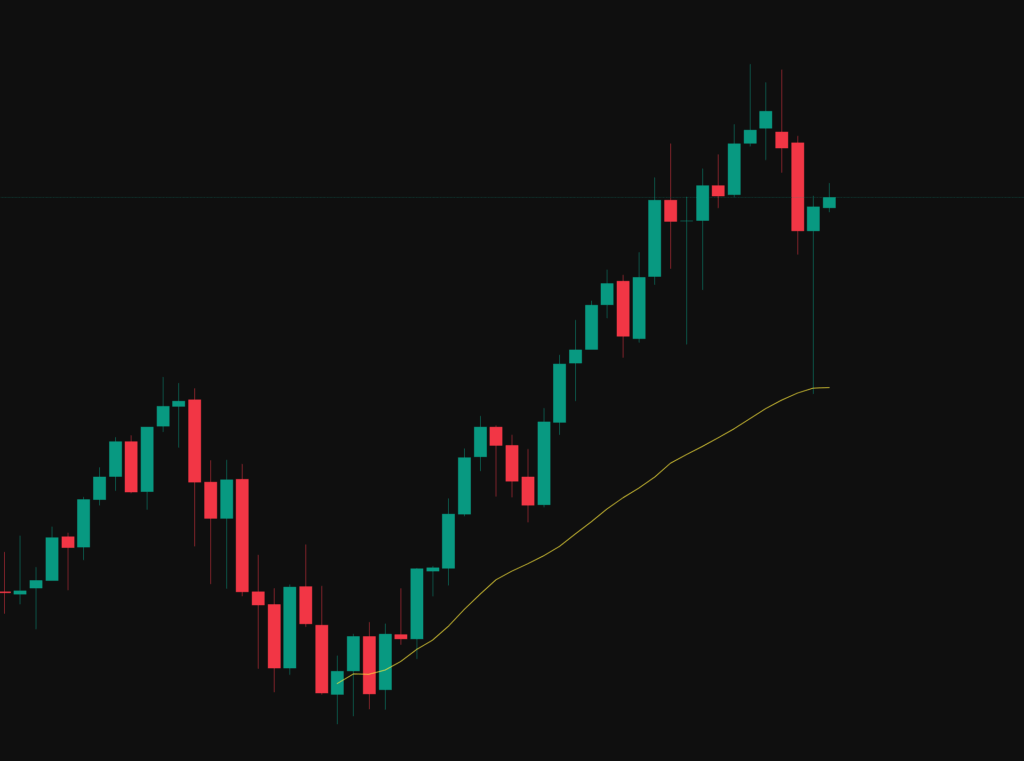
After the strong sell off in April the Nasdaq ended the month with a bullish candle
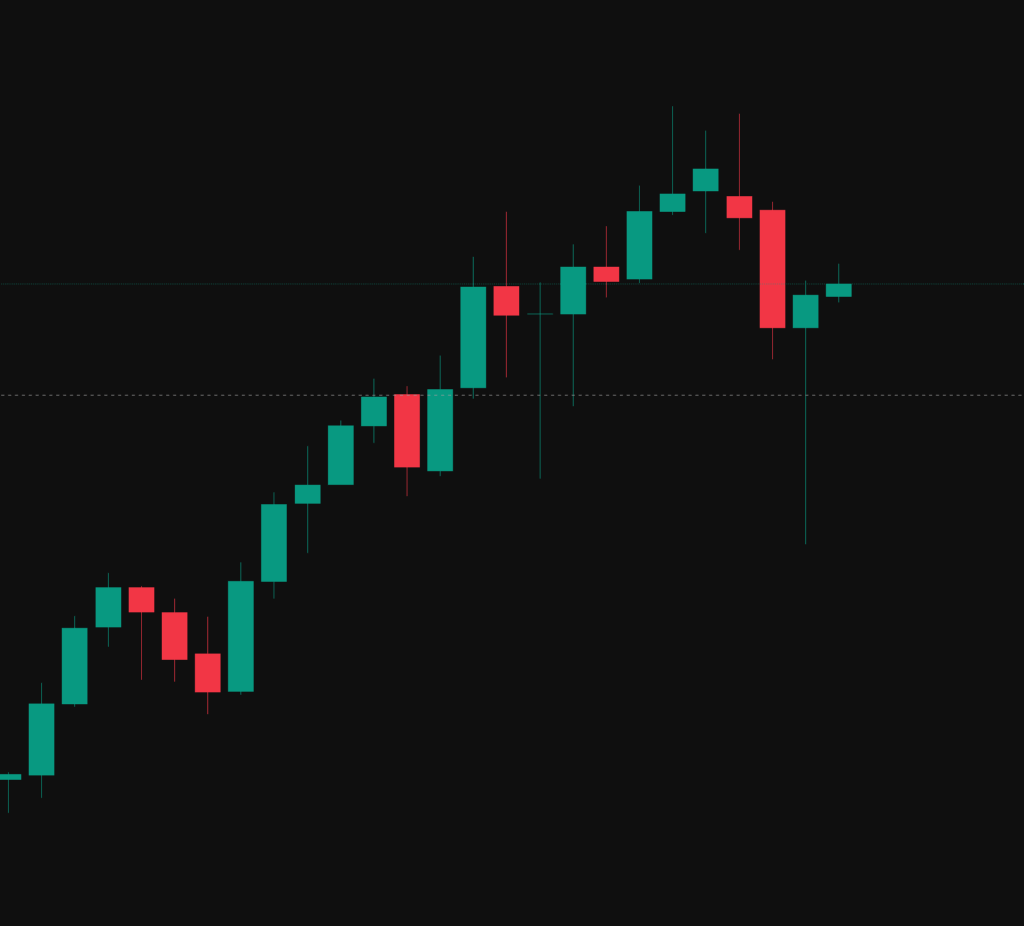
Looking at the below monthly chart on NQ! we can see price found support on a anchored vWAP pulled from the October 2022 lows.
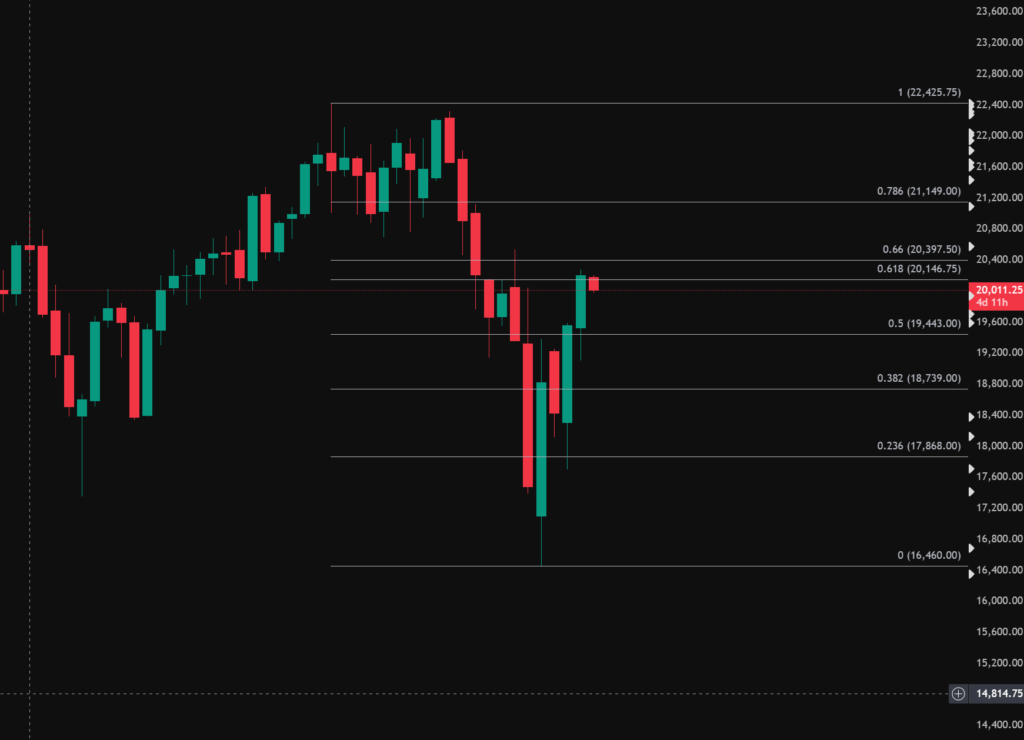
On the weekly time frame we can see the NQ is finding resistance at the 0.618 fib retracement, the question is will the Nasdaq continue the bullish momentum or start to retrace.
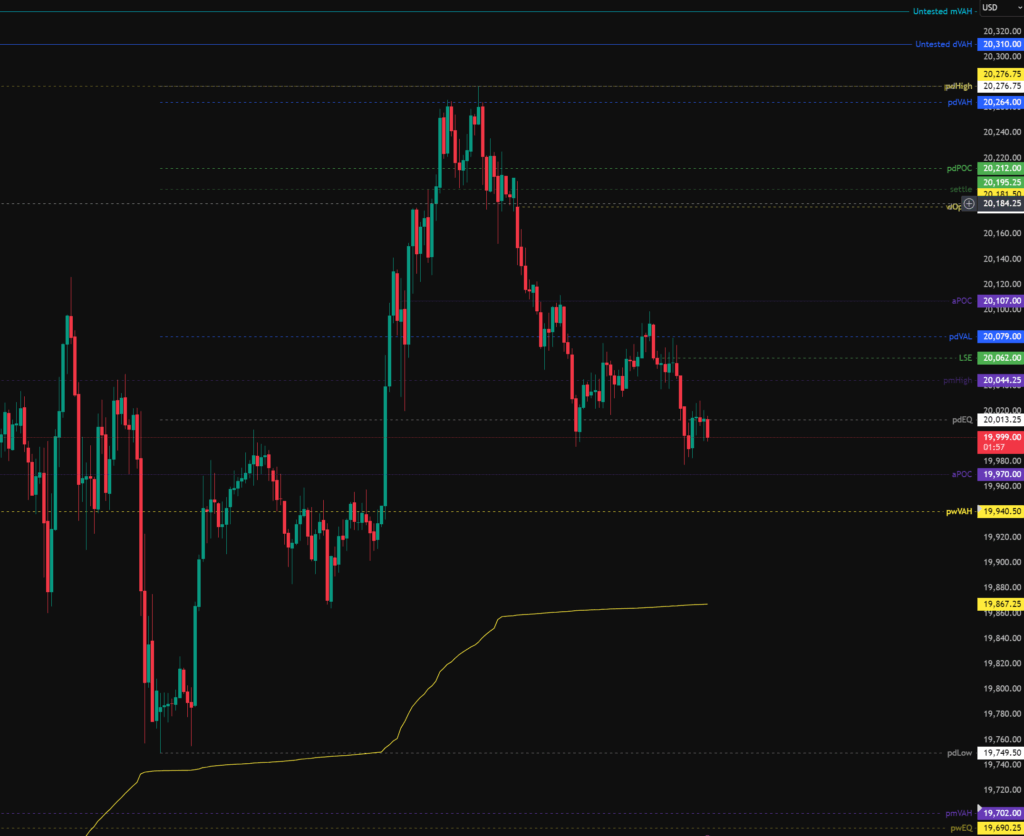
On the current daily chart below we can see that the NQ may be starting to flip the pdEQ in to resistance.
Trading Plan
After the strong sell off in April the Nasdaq (NQ) is now looking bullish on all time frames with market structure pointing to further upside.
The daily open and weekly open are both in the upper quartile of previous day and week range, therefore statistically speaking new highs should be expected.
Given the bullish uptrend more favour should be given to long trades, however care should be given to be aware of news coming from the US which could switch the market bearish very quickly.
Todays levels of support where price may, or may not give a reaction are:
- 20,940.50 – pwVAH (Previous Week Value Area High) which is in confluence with the 0.618 / 0.66 Fib retracement.
- 19,862 – Anchored vWAP pulled from Wednesday 30th April low in confluence with the 0.786 fib and taking liquidity resting below a local low.
- 19,702 – pmVAH (Previous Month Value Area High) in confluence with the pwEQ (Previous Week Equilibrium)
Todays levels of Resistance where price may, or may not give a reaction are:
- 20,310 – Untested Daily Value
- 20,336 – Untested Monthly Value
News events to be aware of:
- 14:45 GMT – S&P Global Services PMI
- 15:00 GMT – ISM Services PMI
The above levels are intended as areas of interest only, they are not in anyway financial advice and a valid entry trigger, stop loss placement and target needs to be considered before entering any position.