
Yesterdays NY session saw weakness locally on the Nasdaq and we saw a nice reaction from the $21,300 level given in yesterdays NQ technical analysis.
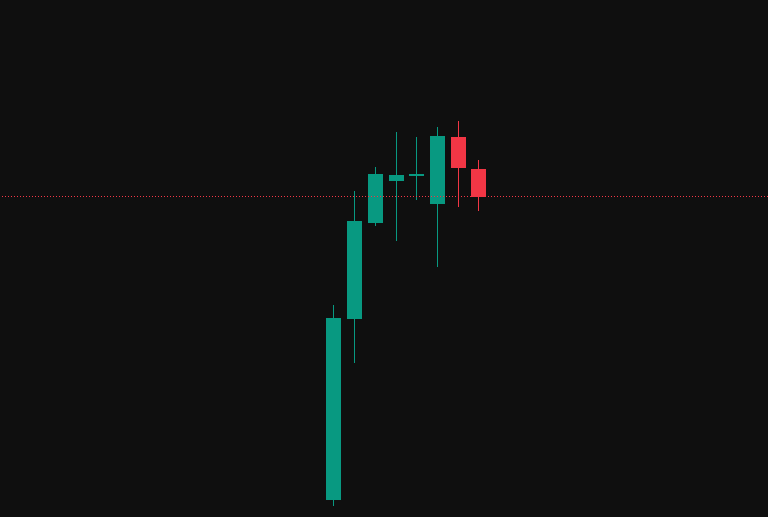
The below chart gives a daily view of the NQ, we can see a reversal candle has been printed and possible signs of a rounded top. Today buyers need to step in to keep the bullish momentum going or we will be starting to see signs of a potential pullback brewing.
Trading Plan
On the below 30m NQ Futures chart we can see weakness with a series of lower highs and lower lows, London has opened with a bullish 30m candle. Now we need to see if we get any follow through where we can see all the lower highs cleaned or if this will be another lower low and a further pullback.
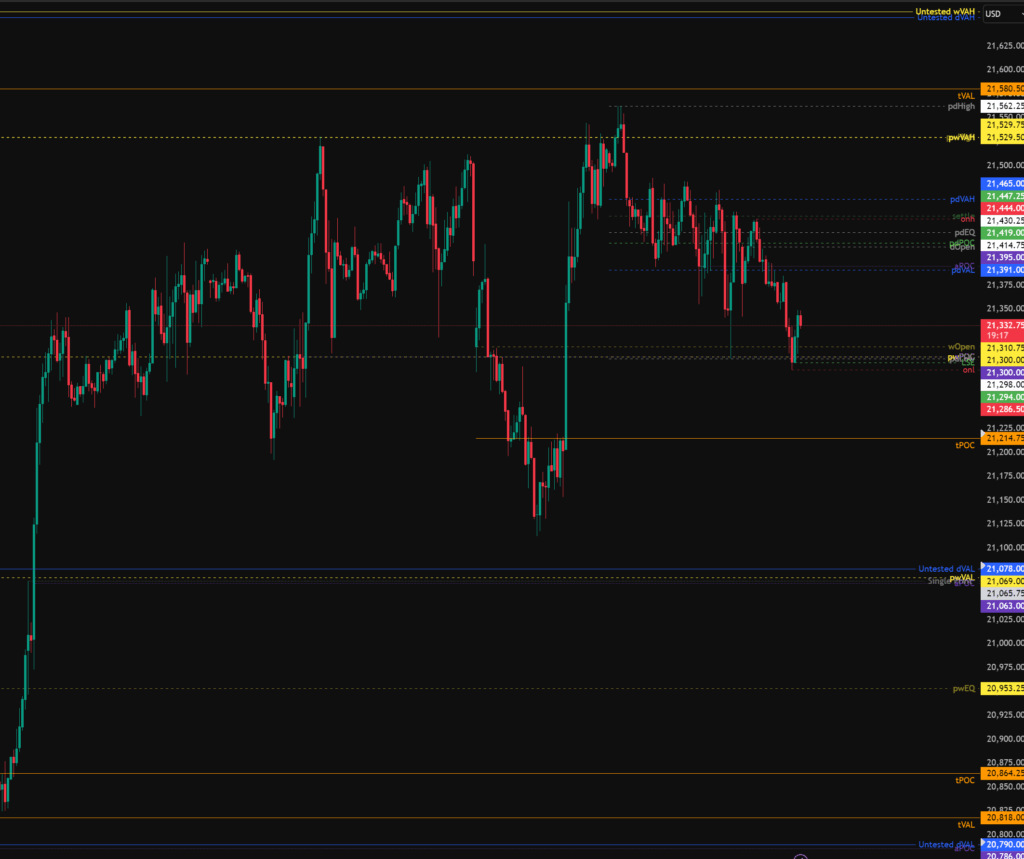
Todays levels of support for the Nasdaq where price may, or may not give a reaction are:
- 21,214 – tPOC, S/R Zone
- 21,078 – Untested daily value, single print, aPOC, Previous Week VAL.
- 20,790 – Untested daily value, aPOC.
- 20,145 – Untested weekly value, gap fill.
Todays levels of Resistance for the Nasdaq where price may, or may not give a reaction are:
- 21,580 – tVAL, Sweep of pdHigh.
- 21,665 – Untested daily and weekly value.
- 21,790 – Monthly naked POC.
High Impact News events to be aware of:
- None.
The above levels are intended as areas of interest only, they are not in anyway financial advice and a valid entry trigger, stop loss placement and target needs to be considered before entering any position.