
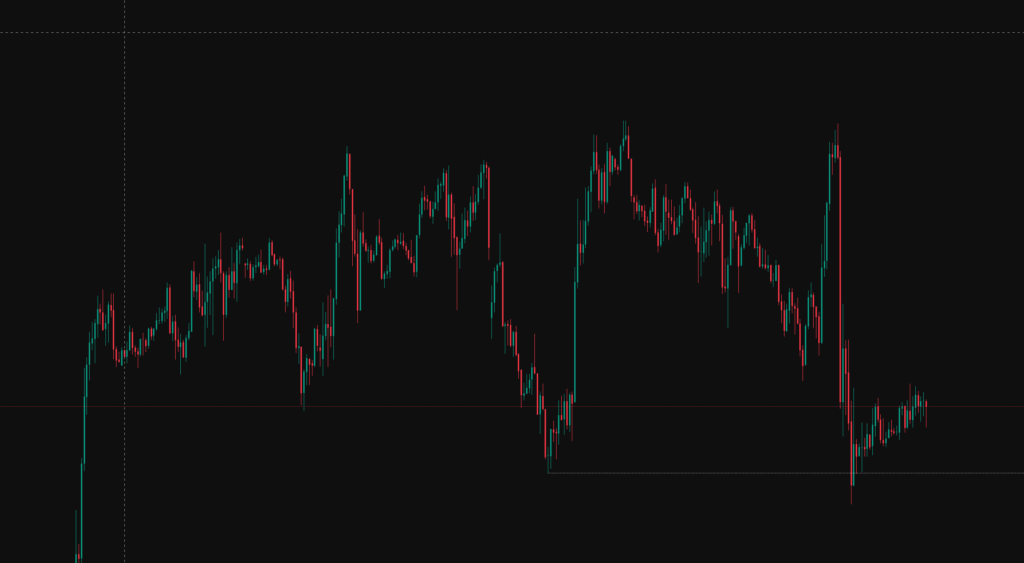
Yesterday Nasdaq saw a pullback, the below daily chart is starting to hit at potential weakness and something we need to monitor.

If we look at the below NQ Futures 30 min chart we can see a liquidity grab into support yesterday, we have no candle closes below Mondays low so we would not look at this as a potential market structure change and this stage, however something we need to monitor during NY and tomorrows trading session.
Trading Plan
The market has been largely rangebound this morning during London session, we are due major data from the US today which will no doubt impact price.
Today saw a daily open in the previous days price range lower quartile, based on our statistics we could expect the previous day low to be taken, however given we are due a data release I would not put to much weight on this statistic today.
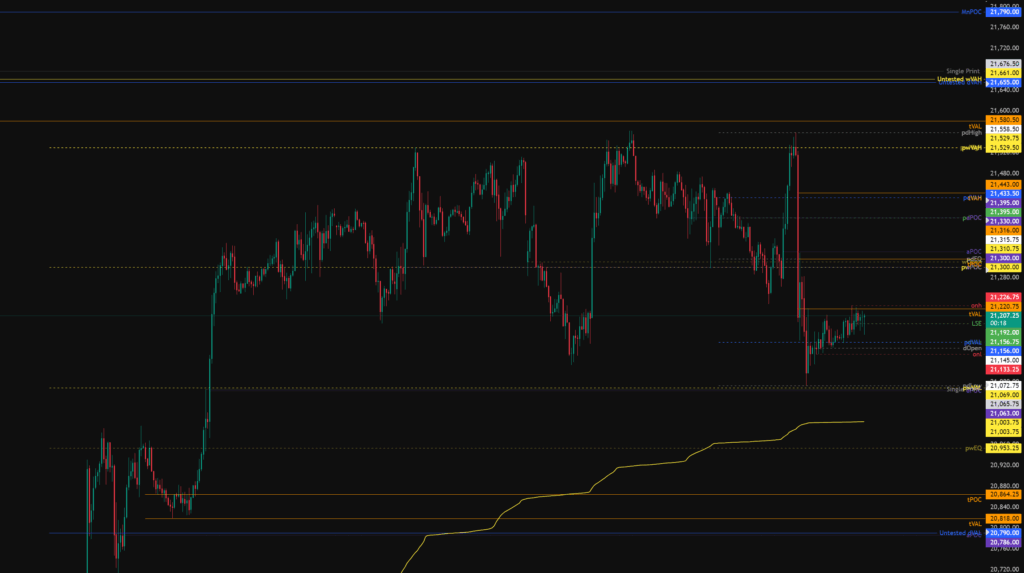
Todays levels of support for the Nasdaq where price may, or may not give a reaction are:
- 21,078 – Single print, aPOC, Previous Week VAL, pdLow Sweep.
- 20,790 – Untested daily value, aPOC.
- 20,145 – Untested weekly value, gap fill.
Todays levels of Resistance for the Nasdaq where price may, or may not give a reaction are:
- 21,300 – pdEQ, tPOC, pwPOC, aPoc.
- 21,395 – pdPOC, aPOC.
- 21,433 – pdVAH, tVAH, 0.75 fib retracement.
- 21,580 – tVAL, Sweep of pdHigh.
- 21,665 – Untested daily and weekly value.
- 21,790 – Monthly naked POC.
High Impact News events to be aware of:
- 13:30 – US Jobless Claims, Continuing Jobless Claims, Initial Jobless Claims.
The above levels are intended as areas of interest only, they are not in anyway financial advice and a valid entry trigger, stop loss placement and target needs to be considered before entering any position.