
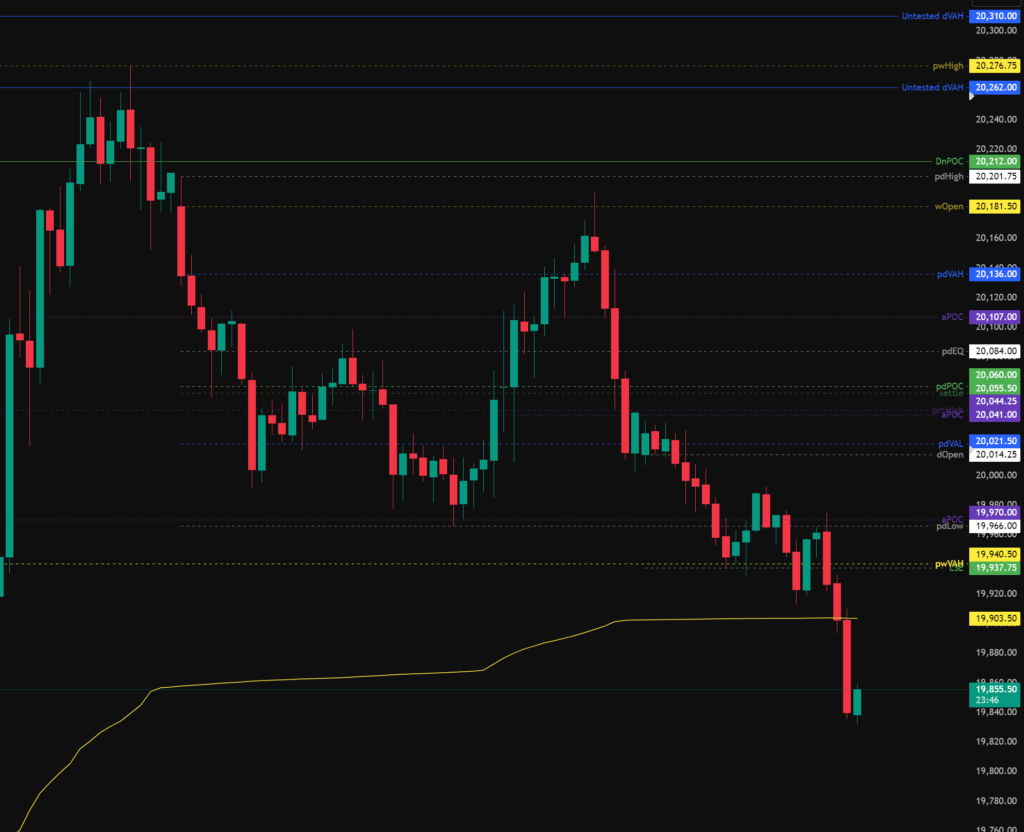
The NQ is very similar to the ES and has been down trending locally since the daily open. On the below 30m chart showing the NQ (Nasdaq) futures we can see the pwVAH offered a small reaction and chance of reversal but saw no follow through.
On the higher time frame charts market structure is sill bullish, however we need to be aware of FOMC tomorrow (Wednesday 7th May 2025) and this data is likely to influence price direction.
Trading Plan
The weekly opened in the upper quartile of the previous weeks range, therefore statistically speaking a new weekly high could be expected this week.
The daily opened in the lower quartile of the previous days price range and the previous days low has already been taken as we would expect as per statistical analysis.
Price is now trading within the pwVA, if price continues to trade under the pwVAH then this could be seen as acceptance and we could expect a test of the pwPOC.
Todays levels of support where price may, or may not give a reaction are:
- 19,702 – pmVAH (Previous Month Value Area High) in confluence with the pwEQ (Previous Week Equilibrium) and 0.5 fib retracement.
- 19,594 – Untested Value, Support Resistance Zone.
- 19,500 – Naked daily POC, pmPOC (Previous Month Point of Control), PwPOC (Previous Week Point of Control), 0.66 Fib.
Todays levels of Resistance where price may, or may not give a reaction are:
- 20,021 – pdVAL, dOpen.
- 20,212 – Daily Naked Point of control, pdHigh sweep.
- 20,276 – Untested Value, pwHigh sweep
- 20,336 – Untested Monthy Value.
News events to be aware of:
- None.
The above levels are intended as areas of interest only, they are not in anyway financial advice and a valid entry trigger, stop loss placement and target needs to be considered before entering any position.