
Yesterday saw a mainly rangebound day with gradual lower highs developing which is hinting at weakness locally and we have nearly filled the impulsive move from Monday.
Heading into todays trading session London has opened bullish with a sweep of the previous days low. Now we need to keep and eye on if we see follow through on this move where we can expect a move to clean all the lower highs or if we will see a drop further in to support.
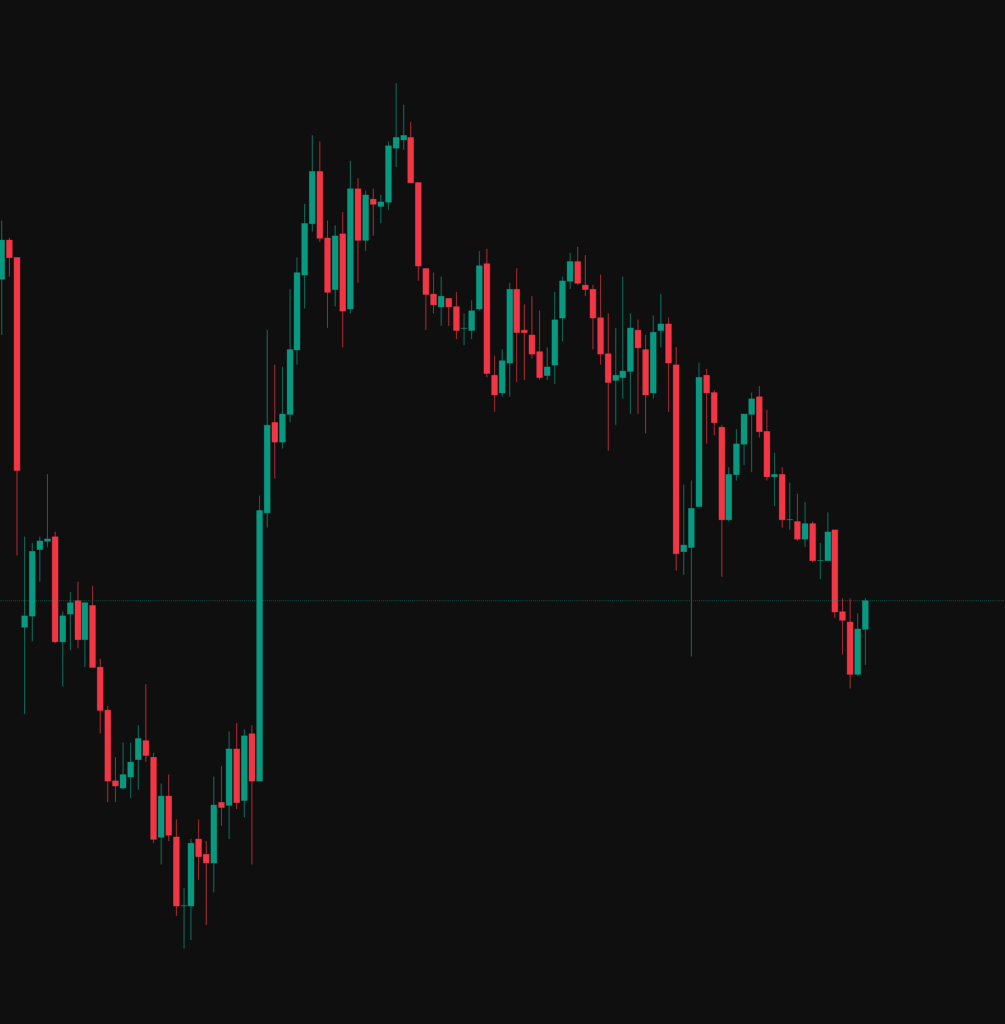
The below chart is a daily ES Futures chart, we can see yesterday closed with a potential reversal candle and yesterday’s low has already been taken. While the S&P 500 market structure is still bullish on the higher time frame we need to be aware of any subtle changes in the market which can feed in to our bias.
Trading Plan
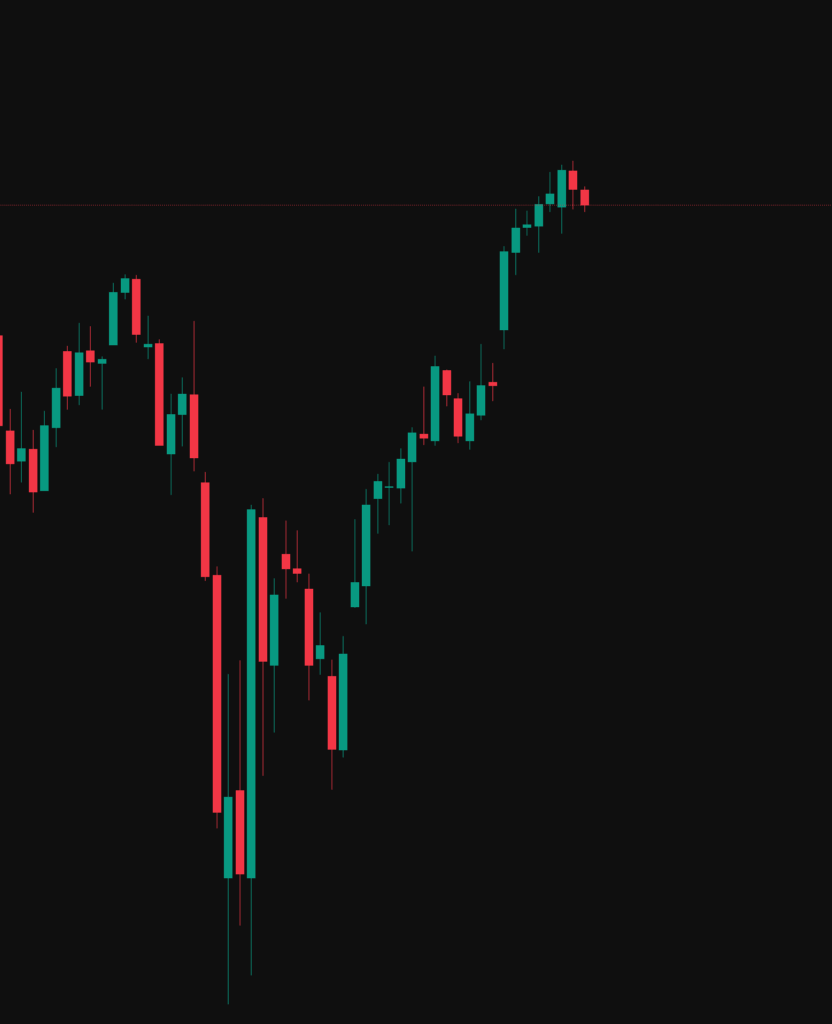
The below chart is a 30m ES Futures chart and we can clearly see the market is in a uptrend and “should” be in an area of support if we would like the bullish momentum to continue.
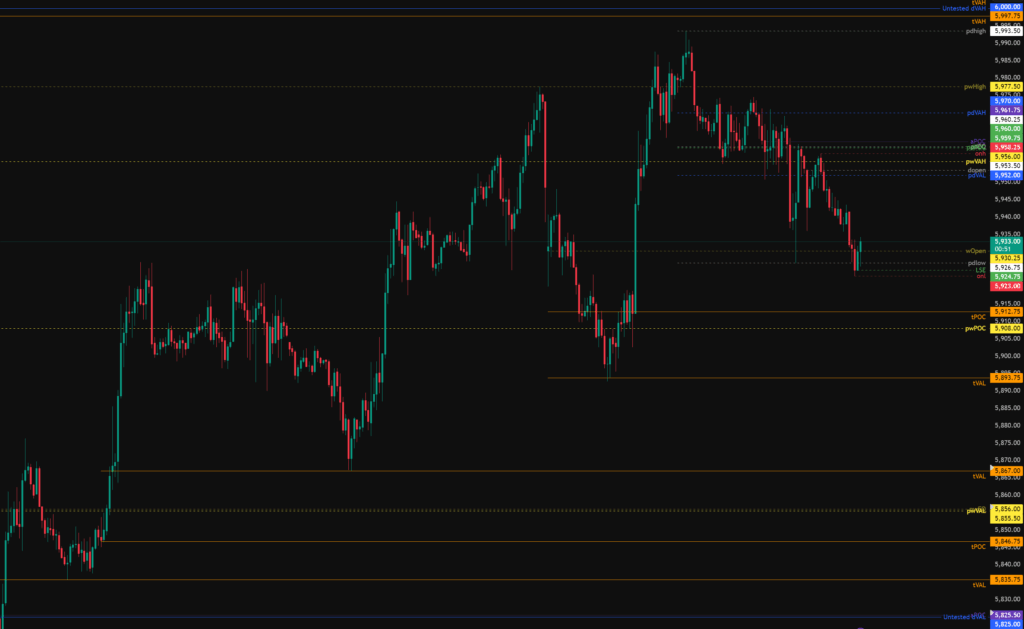
Todays levels of support on the S&P 500 where price may, or may not give a reaction are:
- 5,908 – pwPOC, tPOC.
- 5,890 – tVAL and Liquidity sweep of the lows.
- 5,867 – tVAL and Liquidity sweep of the lows.
- 5,856 – Previous week VAL, previous week EQ.
- 5,825 – aPOC, Untested VAL.
Todays levels of Resistance on the S&P 500 where price may, or may not give a reaction are:
- 6,000 – Untested Value.
- 6,012 – Untested Value
High Impact News events to be aware of:
- None.
The above levels are intended as areas of interest only, they are not in anyway financial advice and a valid entry trigger, stop loss placement and target needs to be considered before entering any position.