
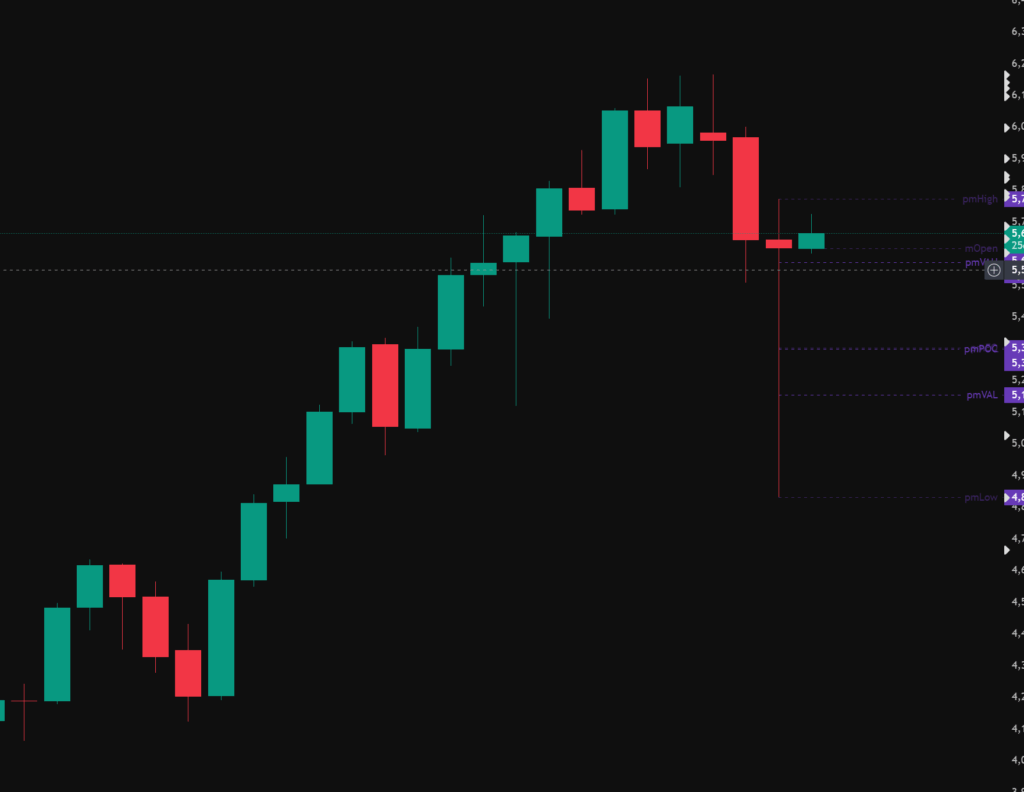
While April saw a strong sell off, it has an equally strong buy back with price now above the April open and close. The below chart is a monthly view of ES1!.
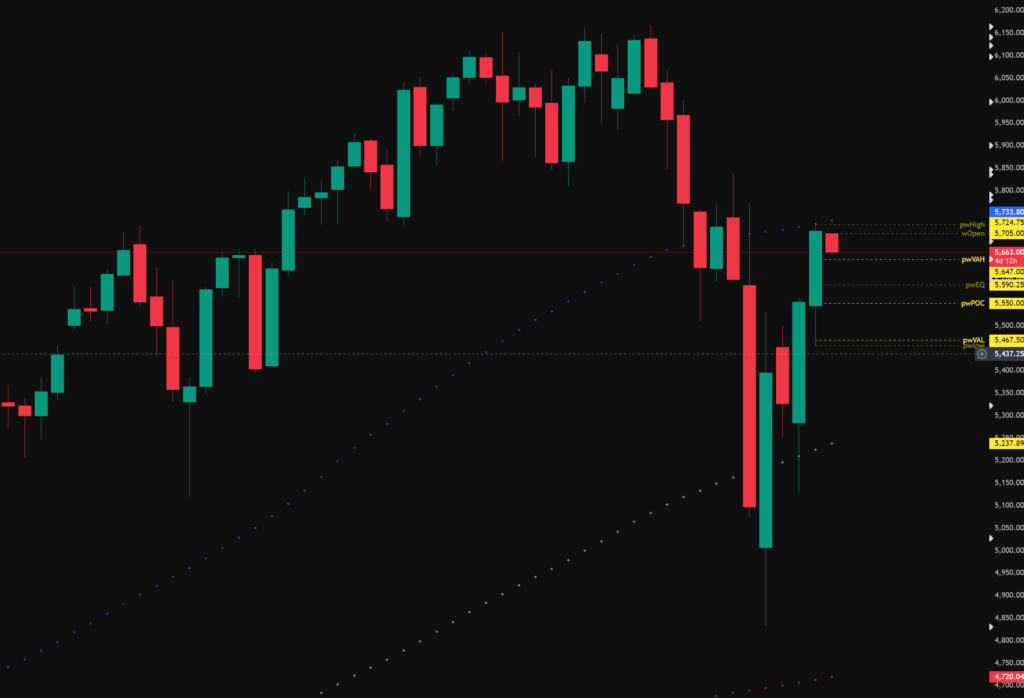
Looking at the below weekly chart we can see price is now finding resistance on the 50 SMA and the week has opened with a slight pull back so far.
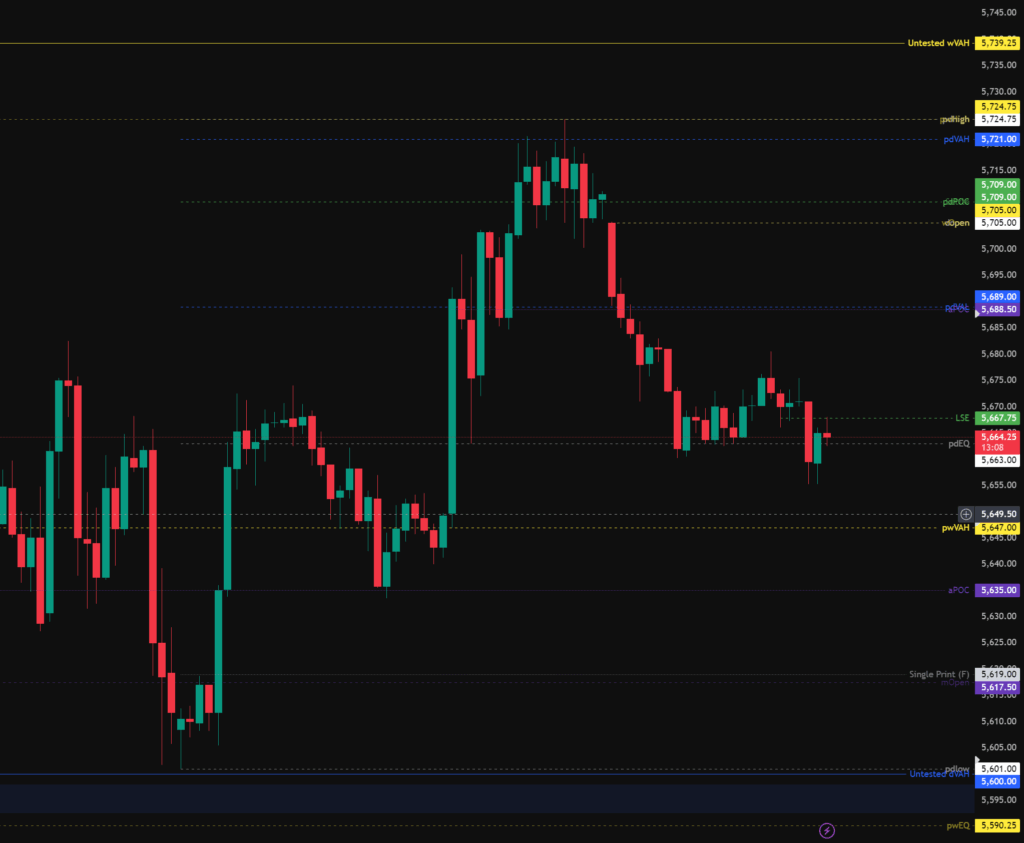
The below chart is a daily overview, currently price is finding support on the pdEQ. (Previous day equilibrium).
Trading Plan
After the strong sell off in April the S&P500 is now looking bullish on all time frames with market structure pointing to further upside.
The daily open and weekly open are both in the upper quartile of previous day and week range, therefore statistically speaking new highs should be expected.
Given the bullish uptrend more favour should be given to long trades, however care should be given to be aware of news coming from the US which could switch the market bearish very quickly.
Todays levels of support where price may, or may not give a reaction are:
- 5,647 – pwVAH (Previous Week Value Area High) which is in confluence with the 0.618 / 0.66 Fib retracement.
- 5,619 – mOpen (Monthly Open) and Single print fill.
- 5,600 – Untested Value, pdLow (Previous Day Low) and SR (Support Resistance) Flip from 29th April.
Todays levels of Resistance where price may, or may not give a reaction are:
- 5,689 – pdVAL (Previous Day Value Area Low) in confluence with the 0.5 fib retracement.
- 5,739.25 – Untested wVAH (Weekly Value Area High).
News events to be aware of:
- 14:45 GMT – S&P Global Services PMI
- 15:00 GMT – ISM Services PMI
The above levels are intended as areas of interest only, they are not in anyway financial advice and a valid entry trigger, stop loss placement and target needs to be considered before entering any position.