
Unlocking Market Insights with the Point of Control: A Trader’s Guide
The world of financial markets is a dynamic arena where participants constantly seek tools and techniques to gain a competitive edge. Understanding price action and identifying key levels where significant trading activity occurs are fundamental aspects of successful trading.
Among the various tools available to traders, the Point of Control (POC) stands out as a powerful indicator that reveals crucial areas of market interest, yet its full potential is often underappreciated. This guide aims to demystify the concept of the POC, explain its different forms, and demonstrate how it can be effectively incorporated into a robust trading strategy to enhance decision-making.
Defining the Point of Control (POC): Where the Market Found Agreement or balance
In the context of trading, the Point of Control (POC) represents the specific price level at which the highest volume of trading activity has transpired during a defined period. This period can range from a single trading session to multiple days, weeks, or even months, depending on the trader’s analytical focus. This price level signifies a point of maximum agreement or equilibrium between buyers and sellers, where the most transactions took place, indicating the price that the market found most acceptable during that timeframe. The POC is a key component of the Volume Profile indicator, a charting tool that displays the volume traded at different price levels over a specified period. On a Volume Profile chart, the POC is typically visualised as the longest horizontal bar, representing the price with the highest volume, or as a distinct horizontal line extending across the profile. The identification of this level is crucial as it often acts as a pivotal point that can influence future price movements, suggesting areas where significant interest from market participants was concentrated.
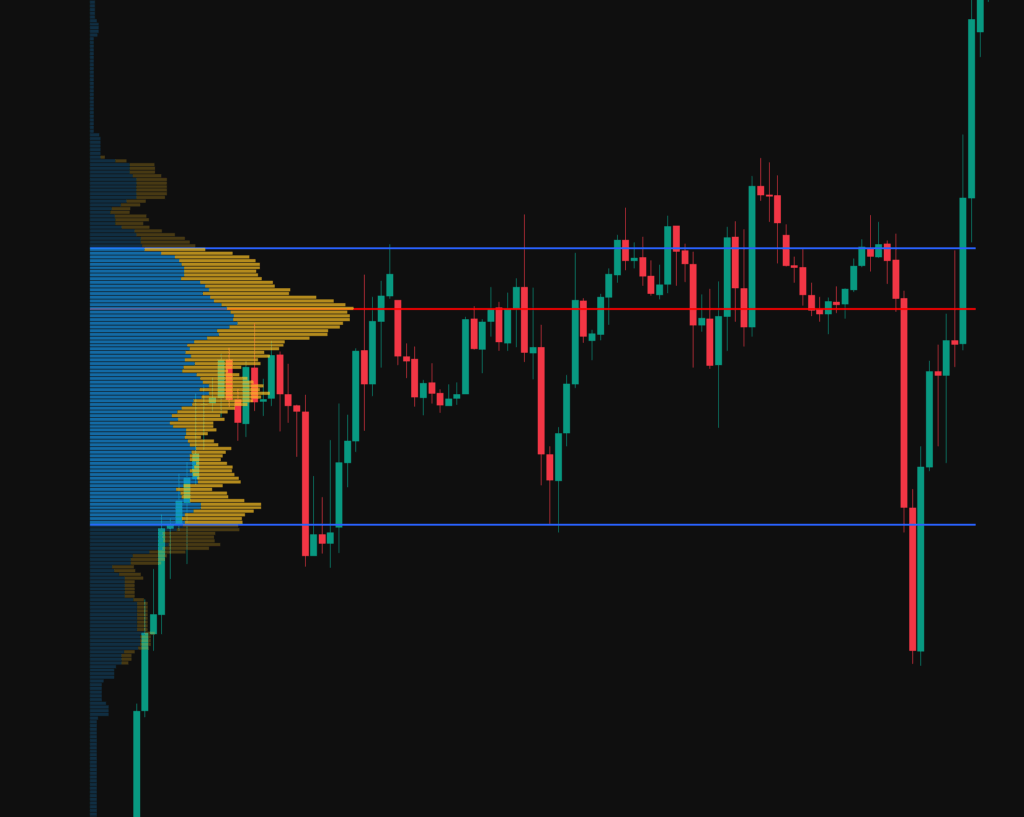
In the below image the point of control is identified by the red line running vertically through the chart, its clear to see from the volume profile on the left that this point is where the most volume has been transacted through the period in question.
Volume Point of Control (VPOC) vs. Time Point of Control (TPOC): What’s the Difference?
While the term Point of Control (POC) is often used generically, it’s important to distinguish between its two primary forms: the Volume Point of Control (VPOC) and the Time Point of Control (TPOC).
The Volume Point of Control (VPOC) is the most commonly understood and utilised form of POC. It is primarily based on the volume of trades executed at different price levels. The VPOC is calculated by identifying the price level that exhibits the highest total traded volume within a specified period, such as a trading session, day, week, or a custom range. This metric emphasises the transactional aspect of market activity, highlighting the price where the greatest number of shares, contracts, or lots changed hands.
In contrast, the Time Point of Control (TPOC) offers an alternative perspective on market activity by focusing on the amount of time the price spends at each level rather than the volume traded. The TPOC is determined by identifying the price level where the market spent the most time trading or consolidating within a defined period. One method for calculating TPOC involves dividing each price bar (candle) into smaller price increments (lots) and then identifying the price level where the most closing prices occurred. This metric emphasises the duration of price acceptance at a particular level, suggesting areas where the market lingered and potentially found a degree of fair value over time.
The key differences between VPOC and TPOC lie in their focus and interpretation. VPOC reflects the price level where the most transactional interest and agreement on value occurred based on volume, signifying areas of high liquidity and potential support or resistance. TPOC, on the other hand, indicates the price level where the market spent the most time, suggesting a strong degree of acceptance and consolidation at that price, potentially highlighting areas of perceived fair value over time. Observing a significant price movement that leaves the TPOC behind while the VPOC remains supportive could potentially indicate the initiation of a new trend, suggesting the importance of analysing both metrics for a more nuanced understanding of market dynamics.
Lets break this down in to an easy to understand summary:
| Feature | Volume Point of Control (VPOC) | Time Point of Control (TPOC) |
| Definition | Price level with the highest traded volume. | Price level where the market spent the most time trading. |
| Calculation | Identified from the Volume Profile as the price with the longest bar. | Determined by analysing time spent at each price level within a period. |
| Interpretation | Represents the area of greatest transactional agreement on value. | Represents the area of greatest price acceptance and consolidation. |
| Emphasis | Volume of trades. | Duration of trading at a specific price. |
| Potential Uses | Identifying strong support/resistance, high liquidity zones. | Identifying areas of perceived fair value, potential breakout zones. |
| Relationship Insight | Supportive VPOC after a TPOC breakout may signal trend initiation. | TPOC can highlight consolidation before a high-volume move (VPOC). |
Analysing both VPOC and TPOC can provide a more comprehensive understanding of market behaviour. For instance, if the VPOC and TPOC coincide, it suggests a strong consensus on value that persisted over time. However, a significant divergence between them might indicate periods of high volume at prices where the market did not spend much time, or vice versa, offering deeper insights into market conviction and potential future price movements. The relationship between these two metrics can also be valuable in identifying potential trend initiations or periods of consolidation, further emphasising the importance of considering both in a comprehensive trading strategy.
Harnessing the Power of POC in Your Trading Strategy
The Point of Control, particularly the Volume Point of Control (VPOC), can be a powerful tool for enhancing various trading strategies. Its ability to highlight price levels of significant market interest makes it invaluable for identifying potential support and resistance areas, gauging market sentiment, and even informing strategic entry and exit points.
One of the primary ways traders utilize the POC is by recognising its potential to act as key support and resistance levels. The POC level often behaves like a magnet, tending to attract price back to it after periods of deviation. When the price approaches the POC, it can indicate a higher probability of price congestion, where the market might pause or even reverse direction as buyers and sellers react to this level of significant prior activity.
Furthermore, the concept of a Naked Point of Control (NPOC) or Virgin Point of Control (VPOC) is crucial. An NPOC refers to a POC from a previous trading session or period that the price has not revisited. These unvisited POCs can act as potential future support or resistance levels, as the market may eventually seek to return to these areas of prior high interest.
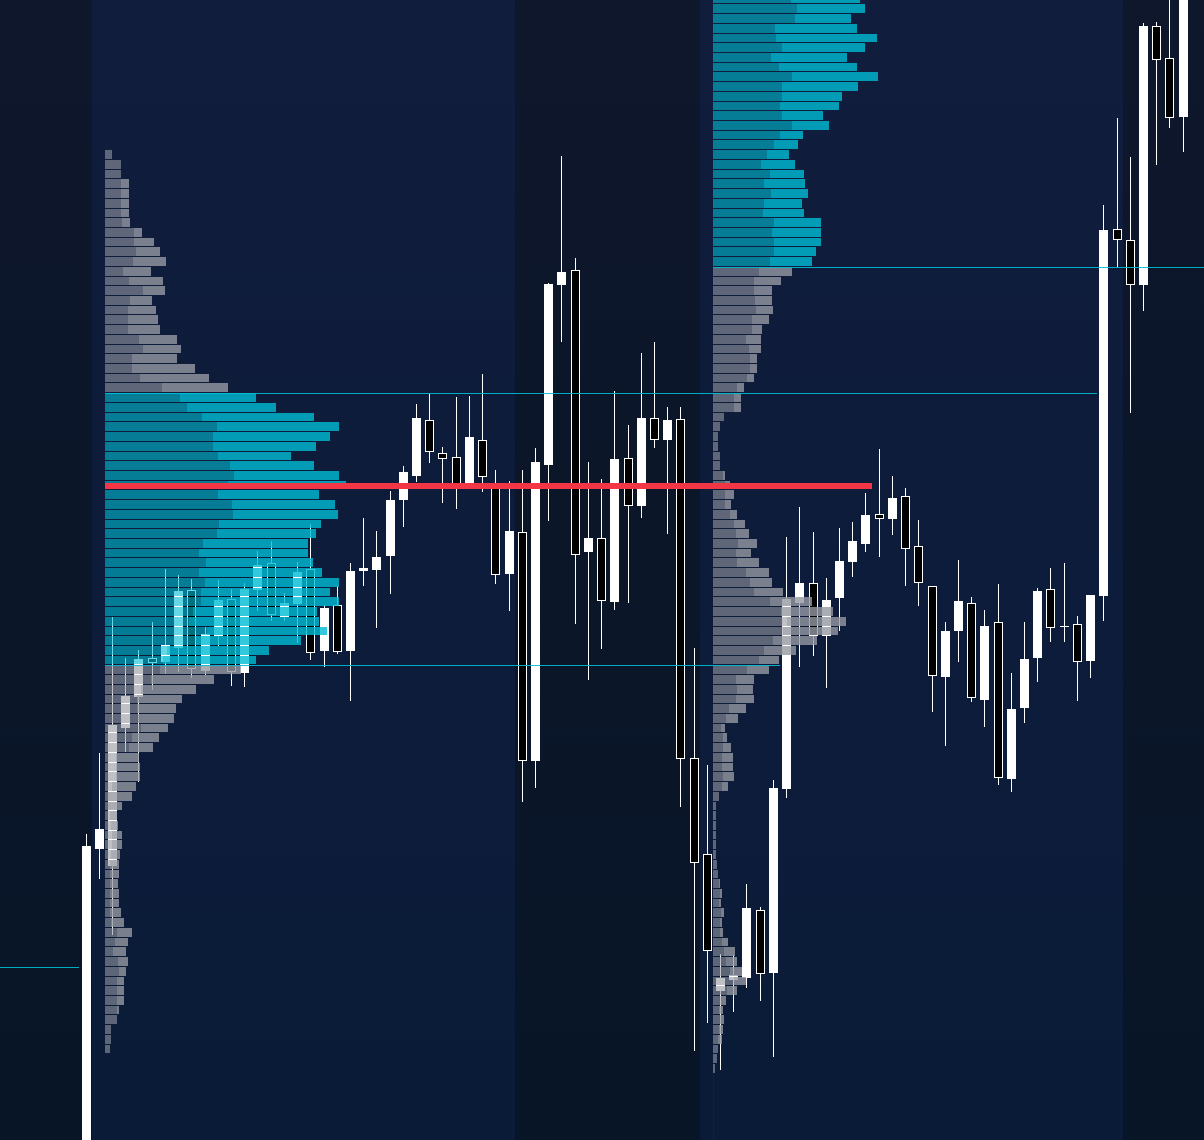
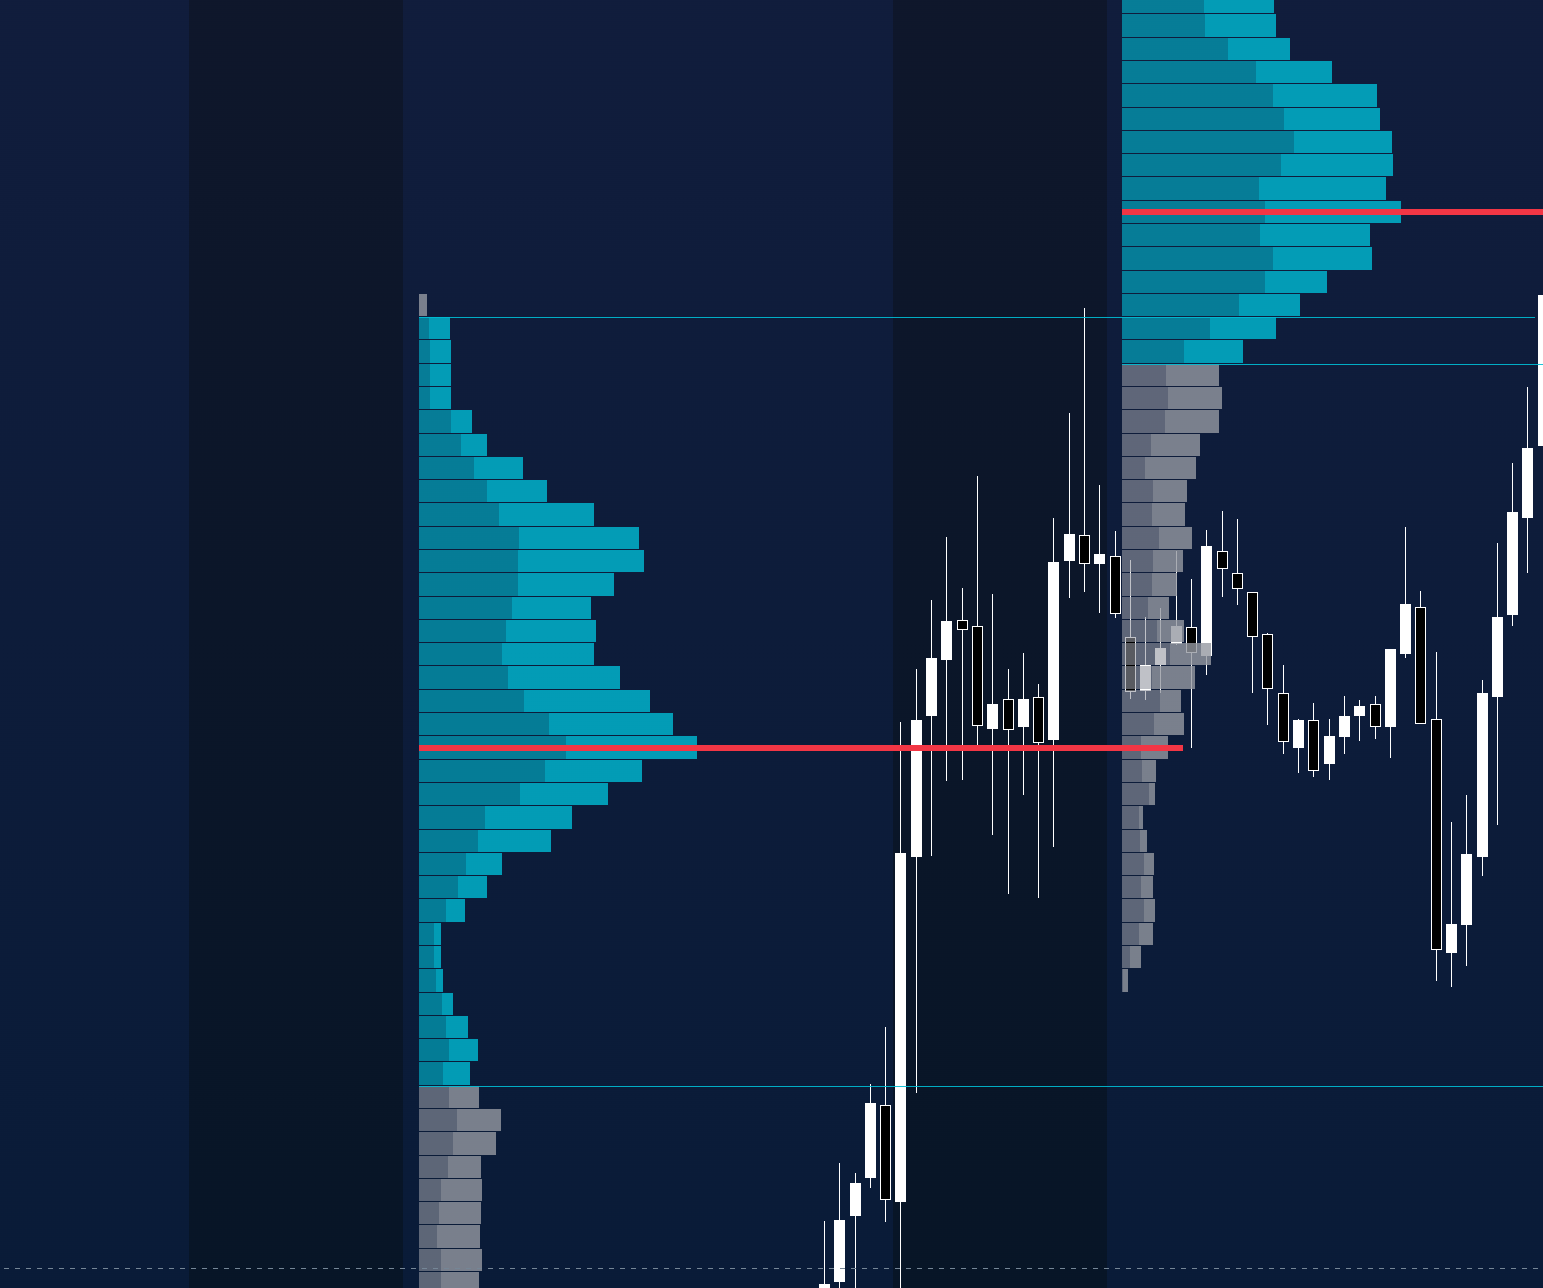
In the below image the first volume profile on the left represents a full days trading and the point of control is highlighted in red. On the following day, price is drawn back towards the POC and on the first touch a reaction in price can be clearly seen.
The POC can also be instrumental in gauging market sentiment and identifying potential reversals. The position of the POC relative to the current price can offer insights into whether the market sentiment is leaning bullish or bearish. Generally, if the POC is above the current price, it may suggest bearish sentiment, indicating that the most significant trading volume occurred at higher prices. Conversely, if the POC is below the current price, it may signal bullish sentiment, as the highest volume traded at lower prices. Additionally, the location of the POC within the Value Area (the price range containing approximately 70% of the trading volume) can provide further clues. A POC positioned near the upper end of the Value Area might suggest a bullish bias within the area of most accepted value, while a POC near the lower end could indicate a bearish leaning. A significant divergence in price action away from the POC might also suggest an impending market reversal, as the market may be rejecting the previously established price of agreement.
Traders can also leverage the POC for strategic entry and exit points in their trading plans. Observing price action around the POC can offer potential entry opportunities. For instance, some traders look for price rejection at the POC level, anticipating a move in the opposite direction, and may enter trades with tight stop-loss orders placed just beyond the POC. The POC can also serve as a valuable reference point for setting stop-loss and take-profit levels. By placing stop-loss orders near the POC, traders can limit their potential losses if the market moves unexpectedly against their position. Similarly, take-profit orders can be set near subsequent POC levels or Value Area boundaries, anticipating potential resistance or support. Another common strategy involves waiting for the price to move away from the POC and then looking for re-entry opportunities on a pullback to the POC in the direction of the initial move, capitalising on the idea that the POC might act as support or resistance after being breached.
It is crucial to understand that the POC should not be used in isolation but rather as a component of a broader analytical framework that includes other technical analysis tools. Combining POC analysis with tools like trend lines, moving averages, Fibonacci retracement levels, and other volume-based indicators can provide stronger confirmation of potential trading signals and lead to higher-probability setups. Considering the overall market context and sentiment, alongside the information provided by the POC, is essential for making well-informed trading decisions.
Practical Applications and Examples of POC in Action
To illustrate the practical application of the Point of Control, consider a few scenarios. Traders can readily identify the POC on various trading platforms, such as TradingView, by applying the Volume Profile indicator. On a daily chart, the POC for the previous day often becomes a level to watch in the current session. If the price opens above the previous day’s POC and then retraces to test it, a bounce off this level could be seen as a potential buying opportunity, assuming other confirming indicators align. Conversely, if the price opens below the POC and rallies to test it, rejection at this level might present a selling opportunity.
The “Mini-POC Test” strategy provides another example. This strategy, often applied in trending markets, involves identifying smaller POC levels (mini-POCs) that form between larger balance zones. If the market is in a bullish trend (higher balance zone above a lower one), a test of a mini-POC level located between these zones could offer a favourable entry point for a long position, anticipating a continuation of the upward trend. Similarly, in a bearish trend, a test of an intermediate mini-POC might signal a continuation of the downward momentum.
Naked Points of Control (NPOCs) can also provide valuable trading signals. For instance, if a strong trend day creates a POC that is not revisited in the following days, this NPOC can act as a future price target. Traders might look for the price to eventually gravitate towards this level, presenting potential trading opportunities as the price approaches it.
Furthermore, the relationship between the POC and the Value Area can inform trading decisions. If the POC is located near the upper end of the Value Area, and the market breaks above the Value Area High, it might suggest strong bullish momentum, and traders could look for buying opportunities on pullbacks towards the Value Area or the POC. Conversely, a POC near the lower end of the Value Area followed by a break below the Value Area Low might indicate bearish momentum, prompting traders to look for selling opportunities on rallies back towards the Value Area or the POC. These examples highlight the versatility of the Point of Control in various trading contexts and its potential to enhance strategic decision-making.
Conclusion: Mastering the Point of Control for Informed Trading Decisions
In conclusion, the Point of Control (POC) is a vital concept for traders seeking to gain a deeper understanding of market dynamics. Representing the price level of highest trading activity, the POC serves as a significant indicator of agreement and equilibrium between buyers and sellers. While the Volume Point of Control (VPOC) focuses on transactional volume, the Time Point of Control (TPOC) highlights the duration of price acceptance, offering complementary perspectives on market interest.
The POC’s utility extends across various aspects of trading strategy. It can be instrumental in identifying potential support and resistance levels, gauging market sentiment and the likelihood of reversals, and defining strategic entry and exit points for trades. The concept of Naked Points of Control further enhances its predictive power by highlighting unvisited levels of prior high interest that may act as future price magnets. However, it is paramount to remember that the POC is most effective when integrated with other technical analysis tools and used within the context of an overall trading plan. By mastering the Point of Control and understanding its nuances, traders can significantly enhance their ability to make more informed and potentially profitable trading decisions in the dynamic world of financial markets.