
The landscape of modern trading is characterised by a constant search for tools and techniques that can provide a competitive edge. Among these, volume-based analysis has gained significant traction, offering a unique perspective on market activity that goes beyond traditional price-based charts. Volume Profile, a powerful tool in this domain, visualises trading volume at different price levels over a specified period, revealing areas of high and low interest. Unlike conventional volume indicators that aggregate volume over time, Volume Profile maps the distribution of volume across various price points, thereby highlighting the prices at which the most and least trading occurred. This visualisation is instrumental in identifying levels where the market has shown the greatest acceptance or rejection of price.
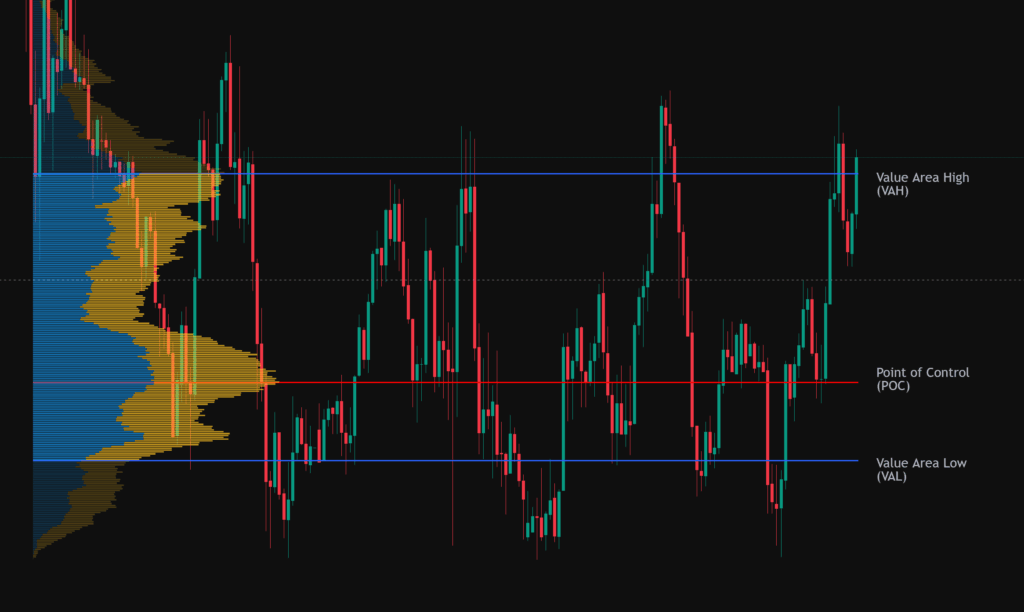
A core component of Volume Profile analysis is the Value Area (VA), which represents the price range where a substantial portion of the total trading volume for a given period has been concentrated, typically around 70%. This range is often interpreted as the area of “fair value” or the price levels where market participants have shown the most agreement. While 70% is the commonly used threshold, traders have the flexibility to adjust this percentage according to their specific analytical needs. The Value Area is bounded by two key levels: the Value Area High (VAH) and the Value Area Low (VAL), which represent the upper and lower limits of this significant volume concentration.
The Value Area High (VAH) is defined as the highest price level within the identified Value Area. This level is often regarded as a potential area of resistance, where selling pressure may increase as price approaches it. Some traders also refer to the VAH as the Upper Value Area. Conversely, the Value Area Low (VAL) is the lowest price level within the Value Area. The VAL is considered a potential support level, where buying interest may emerge, potentially halting further price declines. It is also sometimes referred to as the Lower Value Area.
The Value Area and its boundaries, VAH and VAL, are intrinsically linked to the Point of Control (POC). The POC represents the price level at which the highest volume of trading occurred during the specified period and typically resides within the Value Area. The Value Area itself is constructed around the POC. The calculation involves identifying the POC and then expanding outwards, including price levels with successively high trading volume, both above and below the POC, until approximately 70% of the total volume for the period is encompassed. The highest price within this 70% range becomes the VAH, and the lowest becomes the VAL. This method ensures that these levels are not arbitrary but are derived from actual market participation and volume distribution. The consistent identification of VAH as potential resistance and VAL as potential support across various trading resources suggests a widely accepted interpretation. This shared understanding can contribute to market behaviour, as numerous traders might base their actions on these expectations, leading to a degree of self-fulfilling prophecy where prices react at these levels due to the collective actions of market participants.
The calculation of the Value Area is fundamentally based on the volume of transactions occurring at each specific price level within a defined timeframe. The process generally involves several steps : First, the total trading volume for the chosen period is determined. Second, 70% of this total volume is calculated (or another percentage if the trader prefers a different threshold). Third, the Point of Control (POC), the price level with the highest volume, is identified. Fourth, the Value Area is expanded both upwards and downwards from the POC by including adjacent price levels with the next highest volume. This expansion continues until the cumulative volume within the Value Area reaches approximately the predetermined percentage (e.g., 70%) of the total volume. Finally, once the Value Area is established, the highest price level within it is designated as the VAH, and the lowest price level is the VAL. It is worth noting that the specifics of this calculation can vary slightly depending on the asset being analysed. For instance, stocks typically use the actual traded volume, while futures contracts might use tick volume. Furthermore, Volume Profile indicators often utilise data from lower time frames to construct the profile for a higher timeframe. For example, a daily Volume Profile might be generated by analysing the volume data from all the 1 minute bars within that trading day. This granular approach allows for a more detailed understanding of the volume distribution even on higher time frame charts. The systematic way in which VAH and VAL are derived, based on the statistical concentration of trading volume around the POC, suggests that these levels are not arbitrary. They reflect actual market activity and consensus on price, which is why they are often considered significant reference points for traders.
Volume Profile, and consequently VAH and VAL, are versatile tools that can be applied across various timeframes, providing insights relevant to different trading styles and horizons. For very short term trading, Volume Profiles can be generated over specific local ranges, such as a few hours or a particular trading session. These profiles help identify immediate areas where value is perceived by participants in that specific timeframe. On a daily time frame, the Volume Profile reveals the Value Area for a single trading day, highlighting the price range that represented the fairest value during that session.
Stepping up to a weekly timeframe, the Volume Profile aggregates all the trading activity that occurred over the course of a week, offering a broader perspective on where value was established during those five trading days.
Finally, on a monthly time frame, the Volume Profile provides the longest term view within typical trading analysis, revealing significant areas of value that have been accepted by the market over several weeks.
The interpretation of VAH and VAL can evolve depending on the timeframe being analysed. On shorter timeframes, VAH and VAL might represent temporary zones of equilibrium within a larger prevailing trend. For instance, on an hourly chart, the VAH and VAL could define a short-term consolidation range that ultimately breaks in the direction of the dominant daily trend. In contrast, VAH and VAL on weekly or monthly charts often carry more weight, indicating more substantial levels of potential support and resistance. These longer term levels reflect a broader market consensus on value and can influence price action for extended periods. The interplay between VAH and VAL across different time frames can also be significant. A situation where a daily VAH aligns closely with a weekly VAL, for example, creates a confluence level, suggesting a price point where both short-term and medium-term market participants have agreed on a boundary of value. Such confluence can lead to a stronger reaction when price approaches these levels. Furthermore, traders often monitor the “Developing Value Area High (DVAH)” and “Developing Value Area Low (DVAL)”. These represent the dynamically evolving VAH and VAL as the current trading day progresses, offering insights into intraday shifts in perceived value. Analysing VAH and VAL across multiple timeframes provides a more comprehensive understanding of market structure. Observing how these levels align or diverge can offer valuable clues about the strength and potential longevity of price movements.
VAH and VAL are not merely static levels on a chart; they can be actively incorporated into various trading strategies. One of the most fundamental applications is in identifying potential support and resistance levels. The VAH can act as a ceiling, potentially causing prices to reverse downwards upon reaching it, while the VAL can serve as a floor, potentially leading to upward price reversals. Traders often look for opportunities to enter or exit trades around these levels, typically seeking confirmation from other technical indicators or price action patterns.
VAH and VAL are also crucial in identifying potential breakout and breakdown scenarios. A strong move above the VAH, accompanied by significant volume, can suggest that bullish momentum is building and that the upward trend may continue. Conversely, a decisive break below the VAL with strong volume can signal bearish strength and the potential for further downward movement. Breakouts from the Value Area often indicate that the market is in the process of discovering a new equilibrium at either higher or lower price levels.
In range bound markets, where price oscillates between defined high and low points, VAH and VAL can effectively delineate the boundaries of the trading range. Traders employing range trading strategies might look to buy near the VAL, anticipating a move back up towards the POC and potentially the VAH, and sell near the VAH, expecting a retracement back towards the POC and possibly the VAL.
Another interesting concept related to VAH and VAL is the “80% rule”. This rule posits that if the market opens outside the previous day’s Value Area and then trades back into it for two consecutive periods (for example, two 30-minute periods in the futures market), there is a high probability (though some analysis suggests this might be closer to 60%) that the price will then rotate and move to the opposite side of the Value Area. This can be a valuable framework for anticipating intraday price movements and potential trading opportunities.
Finally, VAH and VAL can be instrumental in managing risk through stop-loss and take-profit placement. In an uptrend, the VAL of a previous period can be used as a trailing stop for a long position, helping to protect profits as the trend progresses. Similarly, in a downtrend, the VAH can serve as a trailing stop for a short position. For initial trade entries, stop loss orders can be strategically placed just beyond the VAL for a long entry or just beyond the VAH for a short entry to limit potential losses if the trade moves against the anticipated direction. Conversely, the opposite end of the Value Area can often be used as a logical take-profit target. For instance, if a trader enters a long position near the VAL, they might set their take-profit order near the VAH. The versatility of VAH and VAL in informing various aspects of trading strategy underscores their importance as analytical tools.
While VAH and VAL can be powerful tools in a trader’s arsenal, it is crucial to understand that they are most effective when used in conjunction with other forms of technical analysis. Relying solely on VAH and VAL might not always yield high confidence trading signals. Combining them with order flow analysis can provide insights into the buying and selling pressure at these key levels, potentially confirming reversals or breakouts. Identifying specific candlestick patterns, such as pin bars or engulfing patterns, near the VAH or VAL can further strengthen trading signals, suggesting a higher probability of price reaction. Moving averages can be used to ascertain the overall trend direction, and looking for confluence where a moving average aligns with a VAH or VAL level can add another layer of confirmation. Similarly, trend lines can be drawn to see if VAH or VAL levels coincide with established support or resistance trends. Fibonacci retracement levels, which identify potential areas of support and resistance based on mathematical ratios, can also be used in conjunction with VAH and VAL to find confluence zones where multiple indicators suggest a potential turning point. Oscillators like the Relative Strength Index (RSI) or Moving Average Convergence Divergence (MACD) can help identify overbought or oversold conditions near the VAH and VAL, potentially signalling an imminent reversal. Finally, observing the Volume-Weighted Average Price (VWAP) in relation to VAH and VAL can provide additional context about market sentiment and potential areas of support or resistance, as VWAP represents the average price at which an asset has traded throughout the day, weighted by volume. This integrated approach, where VAH and VAL are used in concert with other analytical tools, can significantly enhance the robustness of trading strategies.
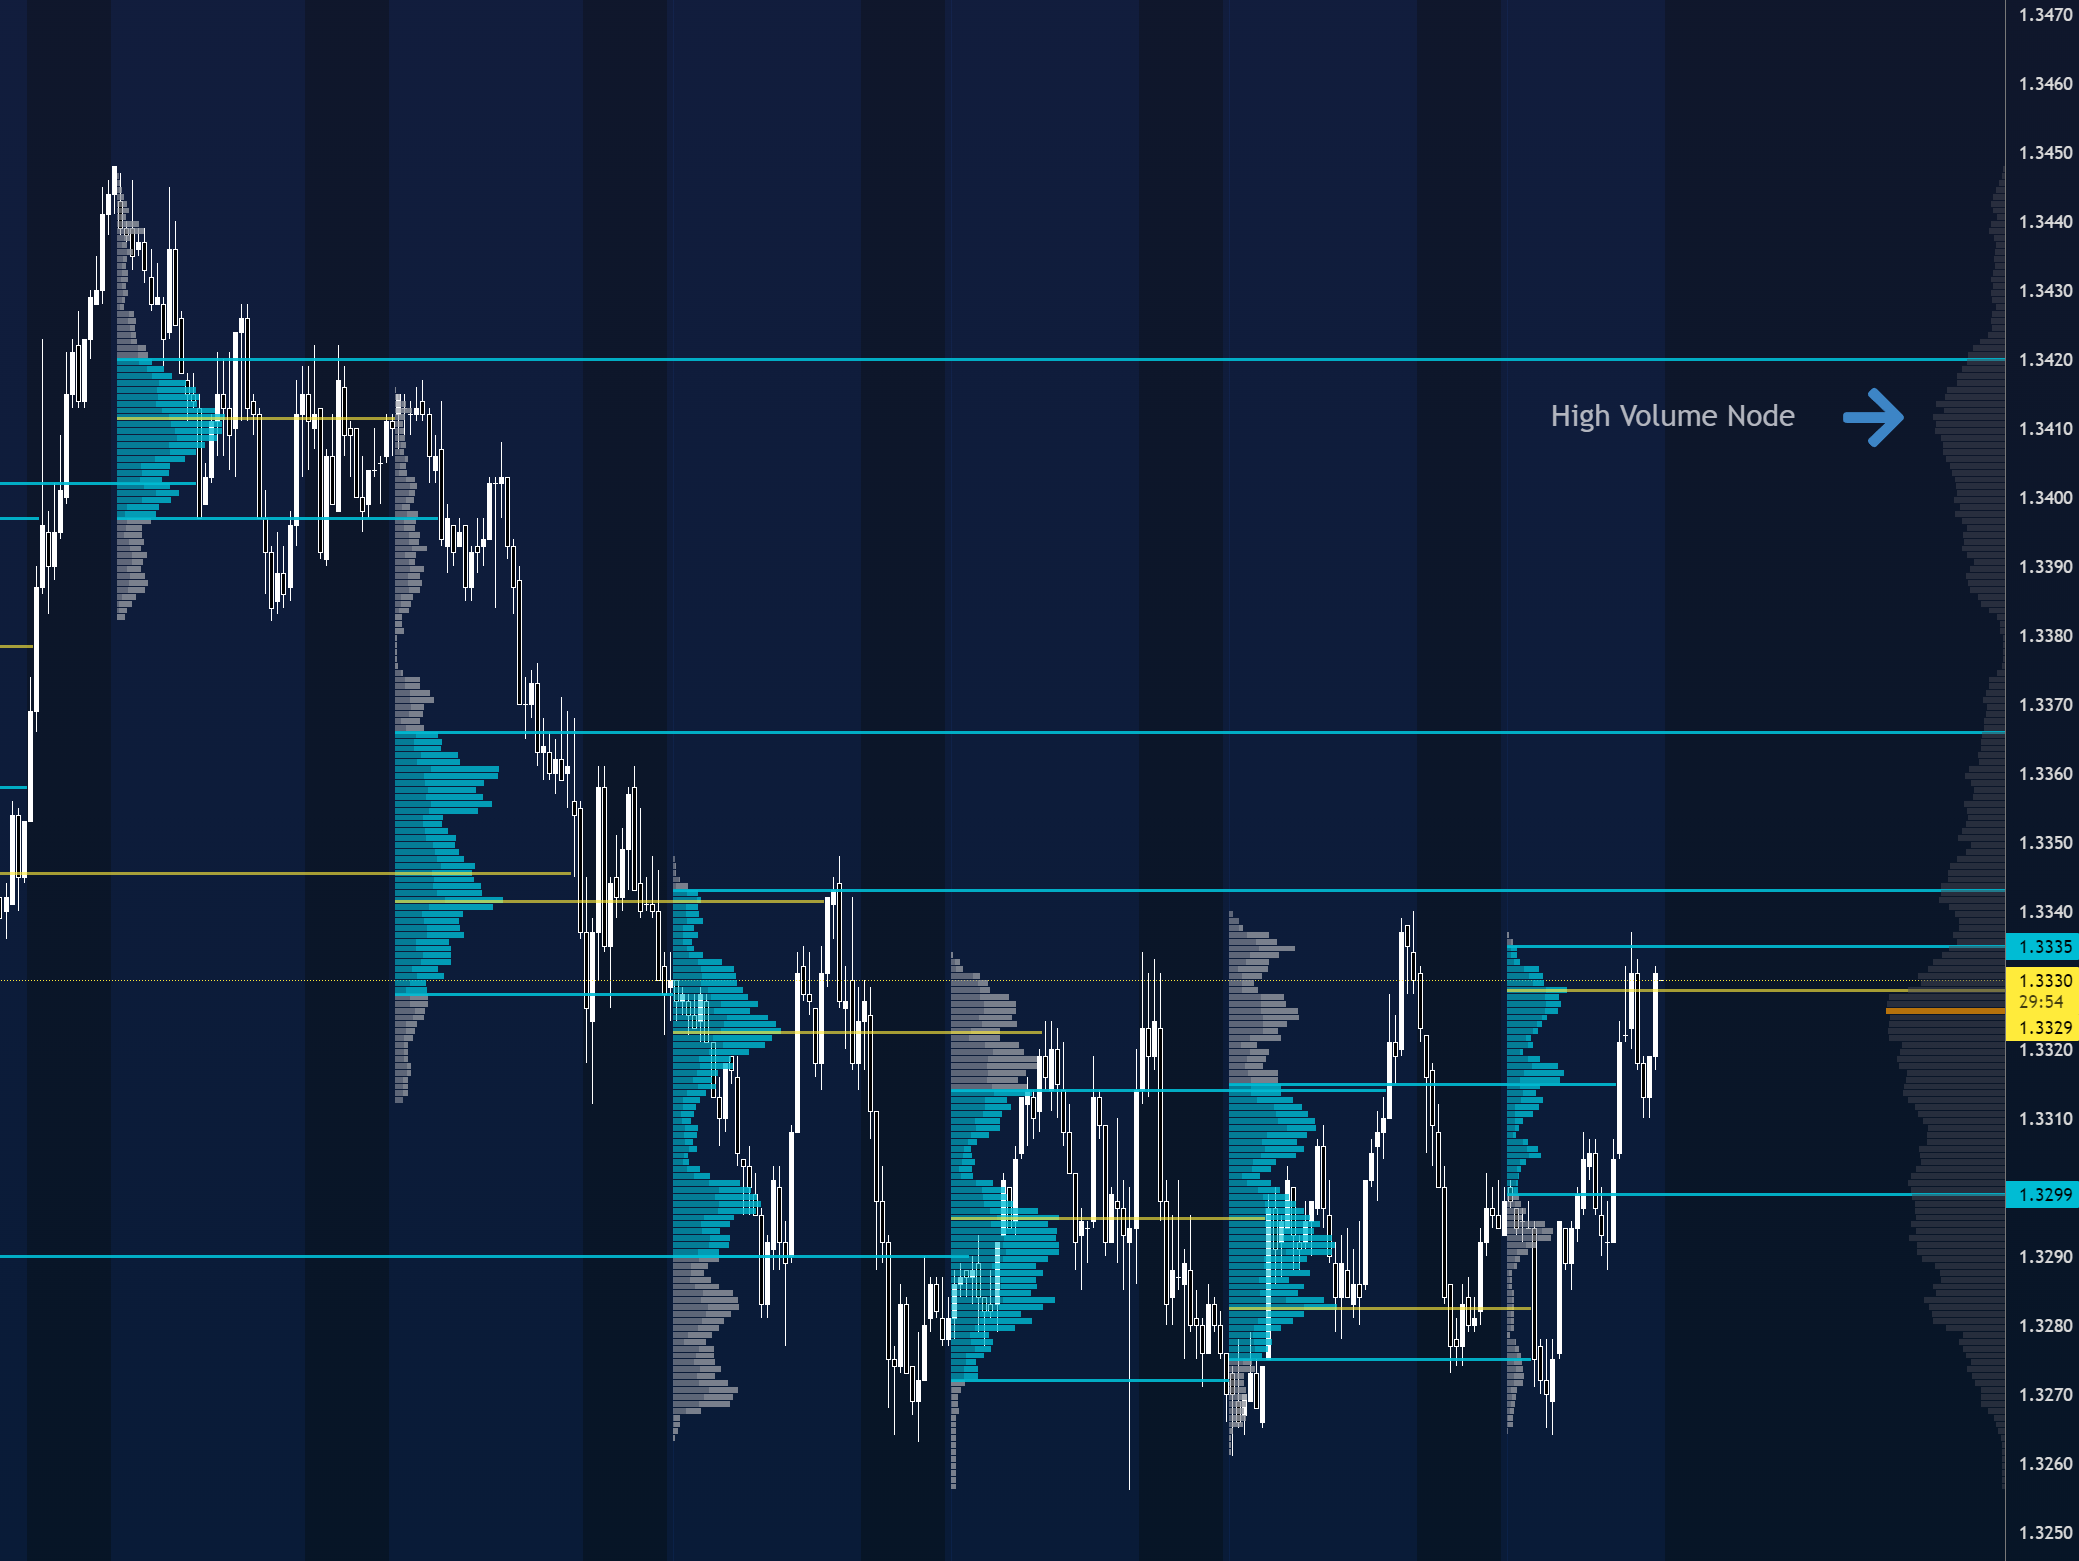
To further refine the application of VAH and VAL, understanding certain advanced concepts within volume profile analysis is beneficial. High Volume Nodes (HVN) are price levels characterised by significant trading activity, often found within or adjacent to the Value Area. These levels can act as strong areas of support or resistance, where price may experience consolidation or reversal.
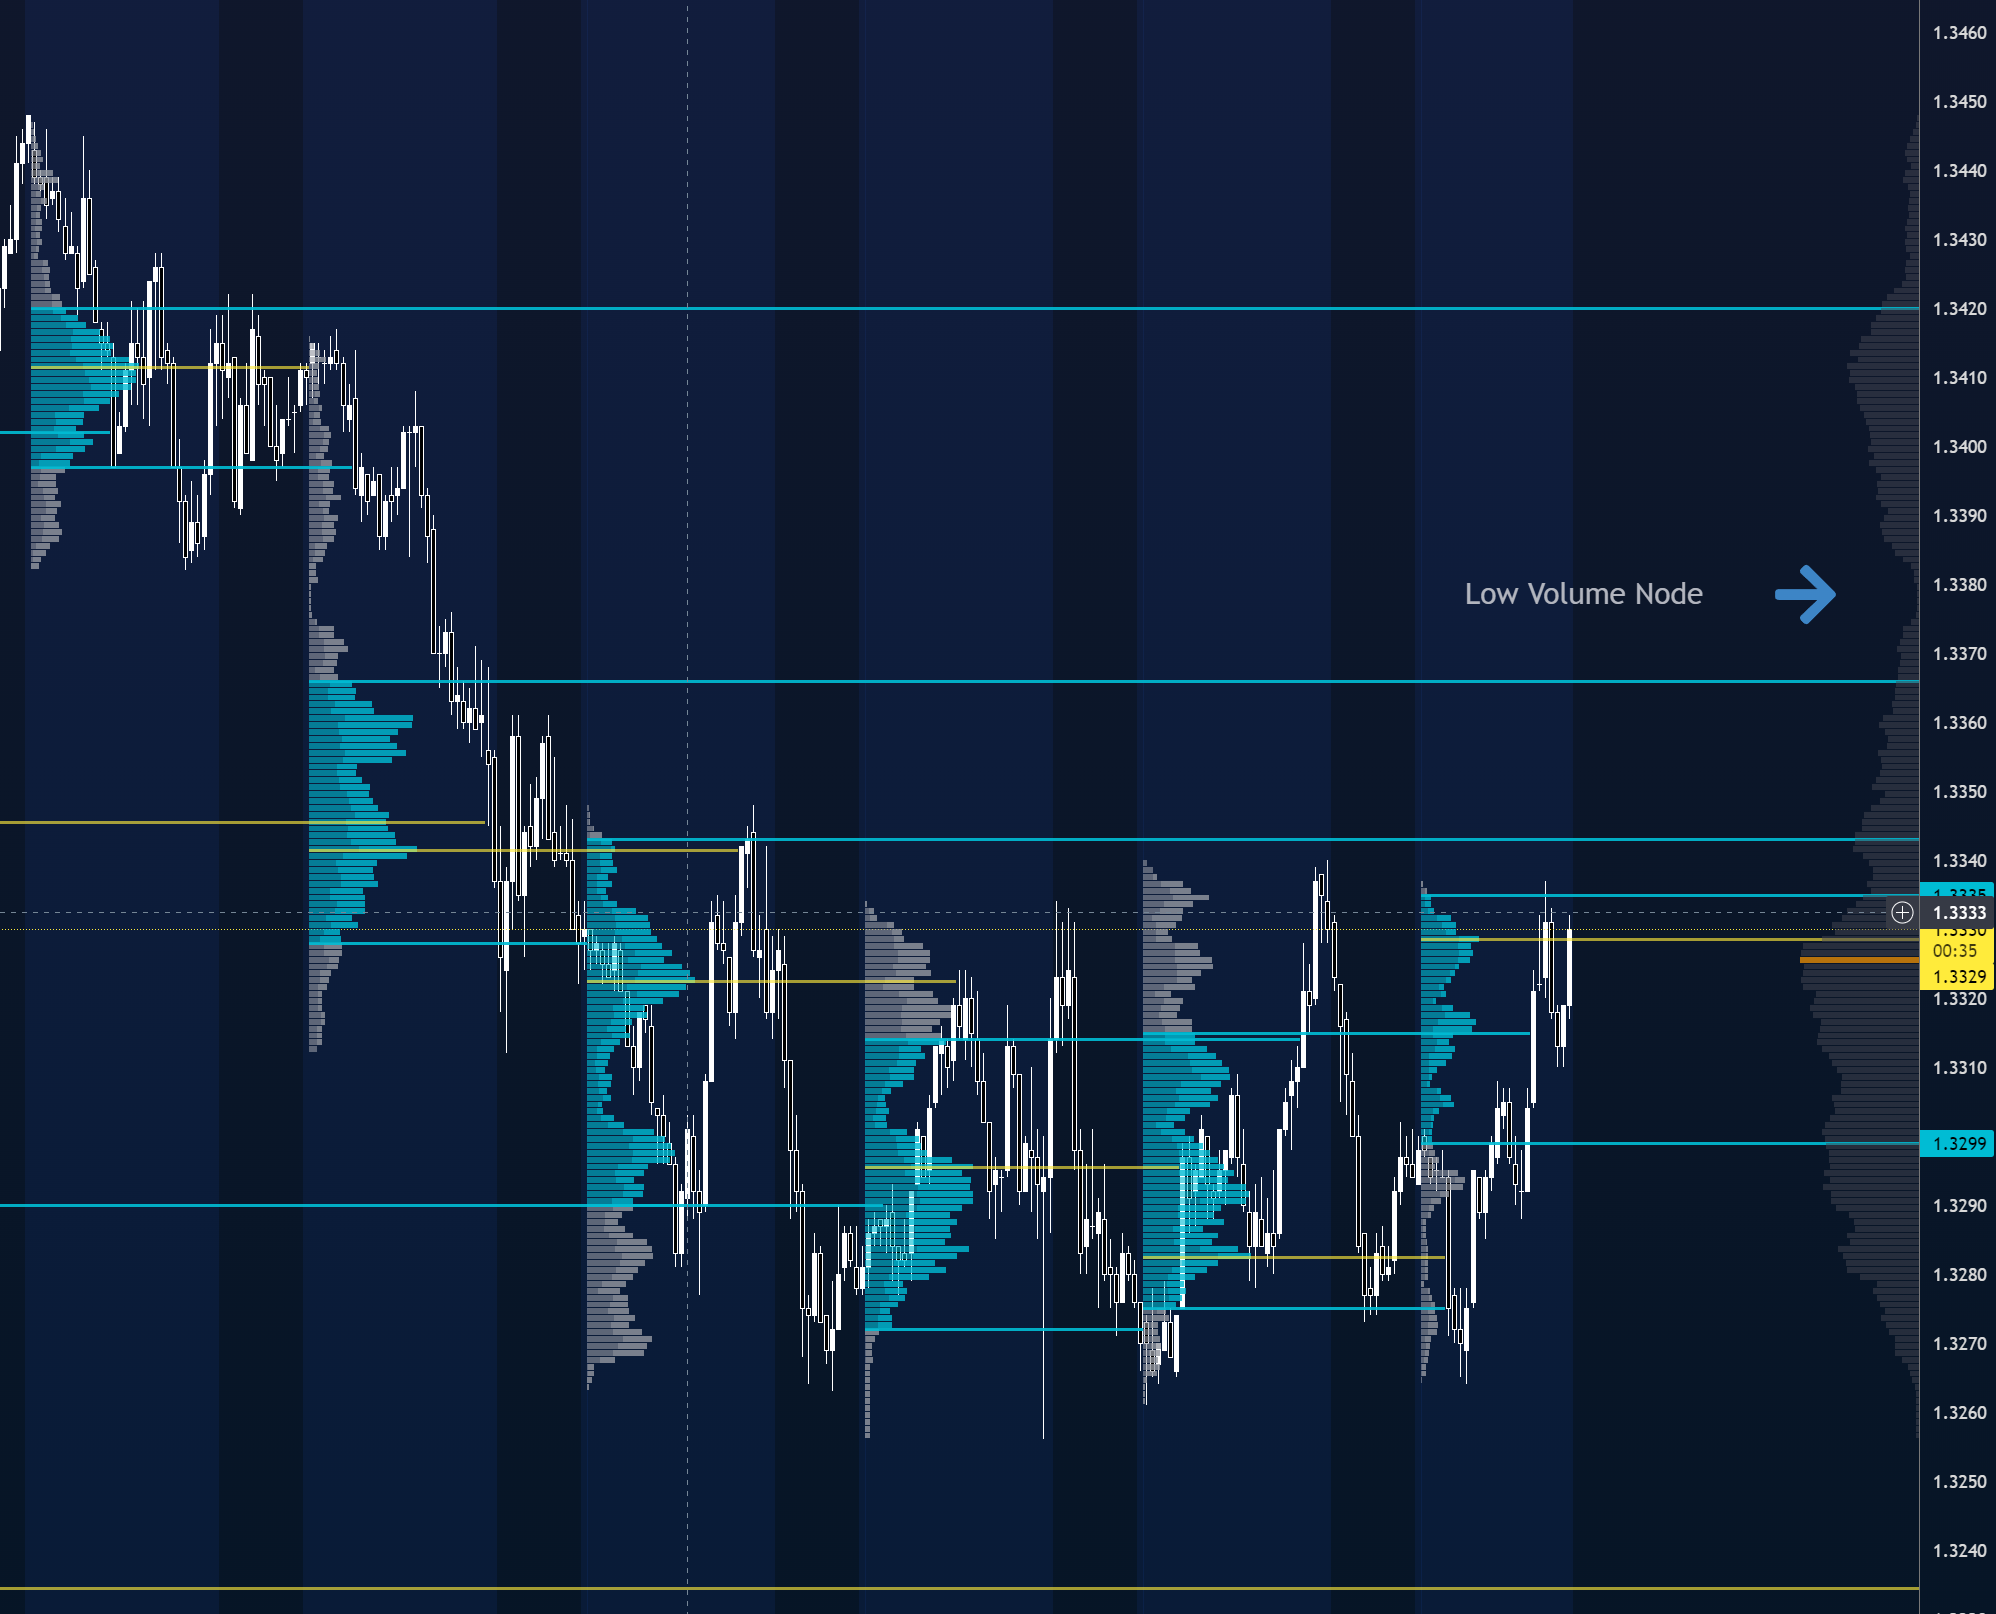
Conversely, Low Volume Nodes (LVN) represent price levels with minimal trading activity, typically found outside the Value Area. Price tends to move quickly through these zones due to the lack of significant buying or selling interest, making them potential breakout or breakdown points.
The overall market context is also paramount when interpreting VAH and VAL. For instance, during a strong uptrend, the VAH of a previous period might be more likely to be breached than in a sideways, ranging market. Traders also pay attention to “Virgin” or “Naked” Point of Control (VPOC), Value Area High (VVAH), and Value Area Low (VVAL). These are levels that have not been revisited since their formation and can hold increased significance as potential future reference points for price action. Finally, the shape of the Volume Profile itself (e.g., P-shape, b-shape, D-shape) and the location of the Value Area within these shapes can offer valuable insights into market sentiment and the potential direction of future price movements. Considering these advanced concepts allows for a more nuanced and informed application of VAH and VAL in trading.
It is important to acknowledge that VAH and VAL, like any other technical analysis tools, have their limitations and are not infallible predictors of future price movements. Market conditions are dynamic and can change rapidly, meaning that levels that previously acted as support or resistance might not hold in the future. Furthermore, slight variations in the calculation of Volume Profile, and consequently VAH and VAL, can occur between different charting platforms or due to different user defined settings. Therefore, it is crucial to avoid relying solely on VAH and VAL for trading decisions. They should be integrated into a comprehensive trading plan that includes robust risk management strategies, such as setting appropriate stop-loss orders. Some traders might also find the interpretation of VAH and VAL somewhat subjective, depending on the specific timeframe and the prevailing market context being analysed. Recognising these limitations is essential for a balanced and realistic approach to trading with Volume Profile.
In conclusion, Value Area High (VAH) and Value Area Low (VAL) are integral components of Volume Profile analysis, providing traders with valuable insights into market-perceived value and potential price boundaries. These levels, derived from the volume of trading activity at different price points, can serve as significant indicators of potential support and resistance, as well as key levels to watch for breakouts or breakdowns across various timeframes. Their practical applications extend to the development of diverse trading strategies, including range trading, anticipating rotational movements, and strategically placing stop loss and take profit orders. However, to maximise their effectiveness, it is crucial to combine VAH and VAL analysis with other technical tools and to consider the broader market context. By understanding the concepts, calculation, and strategic uses of VAH and VAL, traders can enhance their ability to identify trading opportunities and manage risk within a comprehensive and adaptive trading framework.
| Timeframe | Significance | Potential Use |
| Local Ranges | Immediate areas of value within a specific short-term period. | Identifying short-term support and resistance for intraday trading. |
| Daily | The day’s fair price range based on volume. | Identifying daily support and resistance, potential entry and exit points for day trades. |
| Weekly | Broader perspective on value established over a week. | Identifying medium-term support and resistance, useful for swing trading strategies. |
| Monthly | Longest-term view of value within typical trading analysis. | Identifying significant long-term support and resistance, relevant for position traders and long-term investors. |