
Decoding Fibonacci Levels: A Trader’s Guide to Unlocking Market Geometry
The world of trading is a constant quest for understanding market movements and identifying profitable opportunities. Technical analysis, a cornerstone of this endeavor, offers a framework for interpreting price action and predicting future trends. Within the vast arsenal of technical tools, Fibonacci levels stand out due to their widespread adoption and perceived ability to pinpoint key areas of support and resistance. Traders across various markets – from stocks and forex to commodities and cryptocurrencies – frequently turn to Fibonacci retracements and extensions to navigate pullbacks, project targets, and manage risk. Their popularity stems not only from their mathematical elegance but also from the belief that these levels reflect inherent market psychology and behavior. This article aims to cut through the complexity surrounding Fibonacci levels. We will delve into their mathematical origins, explore how they are applied in practical trading strategies, and provide a balanced perspective by also addressing their limitations and criticisms. By the end of this guide, you will have a comprehensive understanding of how to effectively utilise Fibonacci levels to enhance your trading decisions. The consistent mention of Fibonacci levels as “popular” and “go-to” indicates a strong level of acceptance and utilization within the trading community. This widespread use may contribute to their observed effectiveness, as a significant number of traders acting on these levels can indeed influence price movements.
The Mathematical Roots: Unveiling the Fibonacci Sequence and the Golden Ratio
At the core of Fibonacci levels lies the Fibonacci sequence, a series of numbers where each number is the sum of the two preceding ones. Starting with 0 and 1, the sequence unfolds as follows: 0, 1, 1, 2, 3, 5, 8, 13, 21, 34, 55, 89, 144… and so on. This sequence extends infinitely, revealing fascinating mathematical properties. One of the most remarkable properties of the Fibonacci sequence is its close relationship with the golden ratio, often denoted by the Greek letter Phi (Φ). As you move further along the sequence, if you divide any number by its preceding number, the resulting ratio gets progressively closer to approximately 1.618. This ratio, approximately 1.618, is considered the “golden ratio”. Its inverse, obtained by dividing a number by the next number in the sequence, is approximately 0.618.
While Leonardo of Pisa, also known as Fibonacci, is credited with introducing the sequence to Western European mathematics in his 1202 book Liber Abaci, the sequence itself was described by Indian mathematicians centuries earlier. Interestingly, although the Fibonacci sequence is named after him and appeared in his book, Liber Abaci was primarily focused on popularising the Hindu-Arabic numeral system in Europe, which revolutionised commerce and calculation at the time. The famous rabbit breeding problem, which introduced the sequence, was just one of the examples in the book. The appearance of the Fibonacci sequence and the golden ratio extends beyond mathematics into the natural world and artistic creations. From the spiral arrangement of seeds in a sunflower head and the chambers of a nautilus shell to the proportions observed in the human face and famous works of art and architecture, these mathematical concepts seem to underpin patterns of growth, beauty, and efficiency. The fact that the Fibonacci sequence has historical roots predating Leonardo of Pisa, with evidence of its existence in Indian mathematics, suggests a deeper, perhaps universal significance to this numerical pattern. Furthermore, while the rabbit breeding problem is often the introductory example associated with Fibonacci in Liber Abaci, the book’s main contribution was the introduction and popularisation of the Hindu-Arabic numeral system in Europe, a development that fundamentally changed mathematics and commerce.
Fibonacci Retracement Levels: Mapping Potential Support and Resistance
In the context of trading, Fibonacci retracement levels are a powerful technical analysis tool used to identify potential levels of support and resistance. These levels are plotted as horizontal lines on a price chart, indicating areas where the price might retrace or pull back before continuing its primary trend. These levels are based on the key Fibonacci ratios, expressed as percentages of the distance between a significant high and low point. The most commonly used Fibonacci retracement levels include 23.6%, often considered a minor retracement level, indicating a shallow pullback in strong trends; 38.2%, often the first significant level of support or resistance, viewed as a potential “buy-the-dip” zone in uptrends; 50%, while not a true Fibonacci ratio, it is widely used due to its psychological significance as the midpoint of a price range; 61.8%, known as the “golden ratio,” this is a crucial level that often indicates a strong support or resistance point and a key decision point for traders; and 78.6%, often considered the final leg of a retracement, with violations potentially signalling a change in trend. Sometimes 0.75% is also used but again this is not a true Fibonacci ratio. Traders believe that after a significant price move, the price will often retrace a portion of that move and find support or resistance at these Fibonacci levels before continuing in the original direction. To draw retracement levels in an uptrend, identify a recent significant swing low and swing high. Draw the Fibonacci retracement tool from the swing low to the swing high. The levels will appear as horizontal lines between these points.
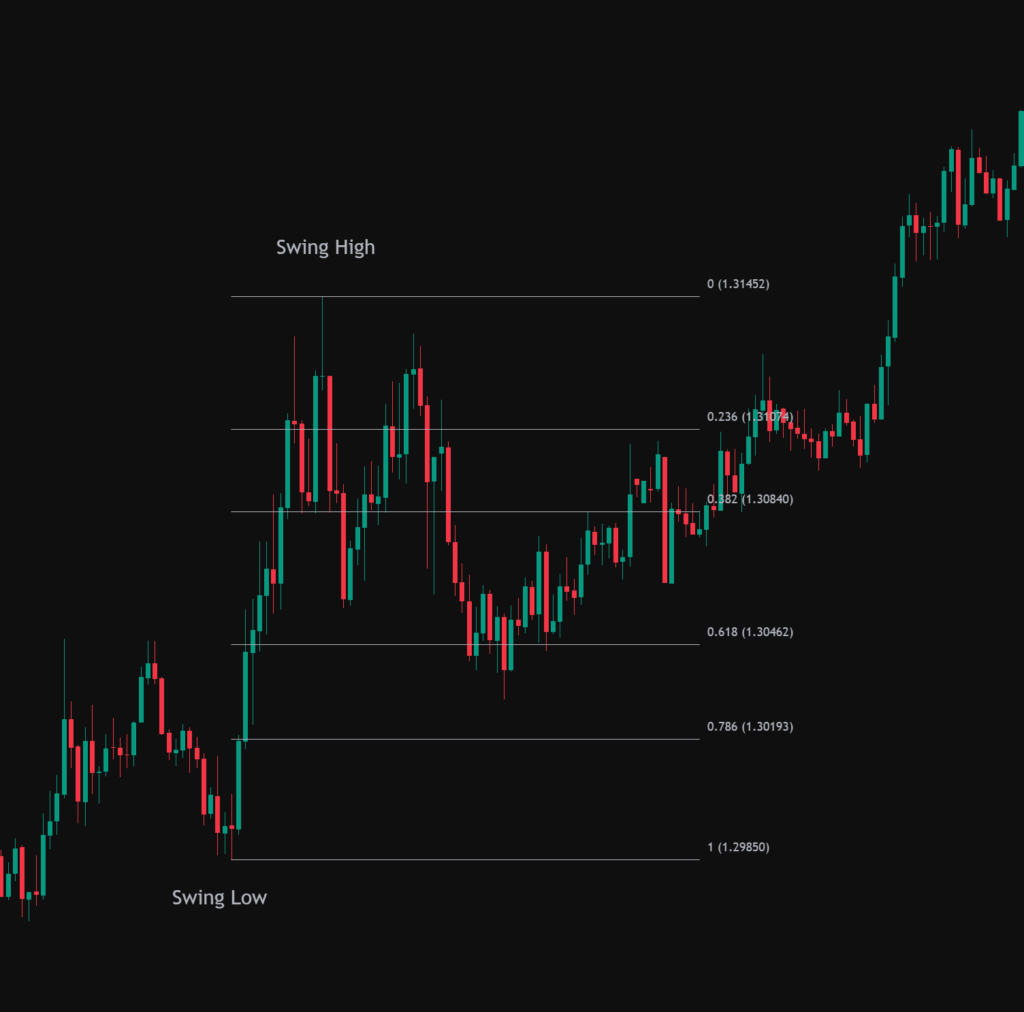
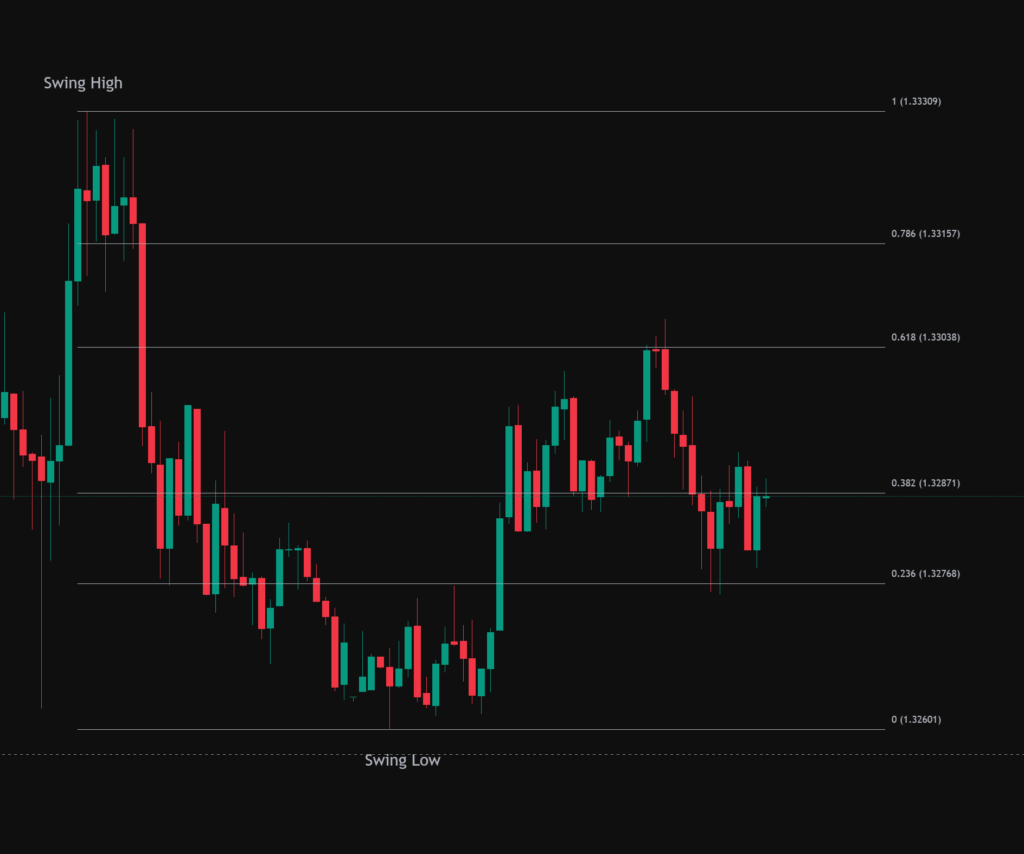
Conversely, in a downtrend, identify a recent significant swing high and swing low. Draw the Fibonacci retracement tool from the swing high to the swing low. The levels will appear as horizontal lines between these points. The consistent inclusion of the 50% level as a key retracement point, despite it not being a direct Fibonacci ratio, underscores its importance in trading psychology. Many traders observe this midpoint, and its alignment with market behaviour often leads to price reactions.
Fibonacci Extension Levels: Projecting Future Price Targets
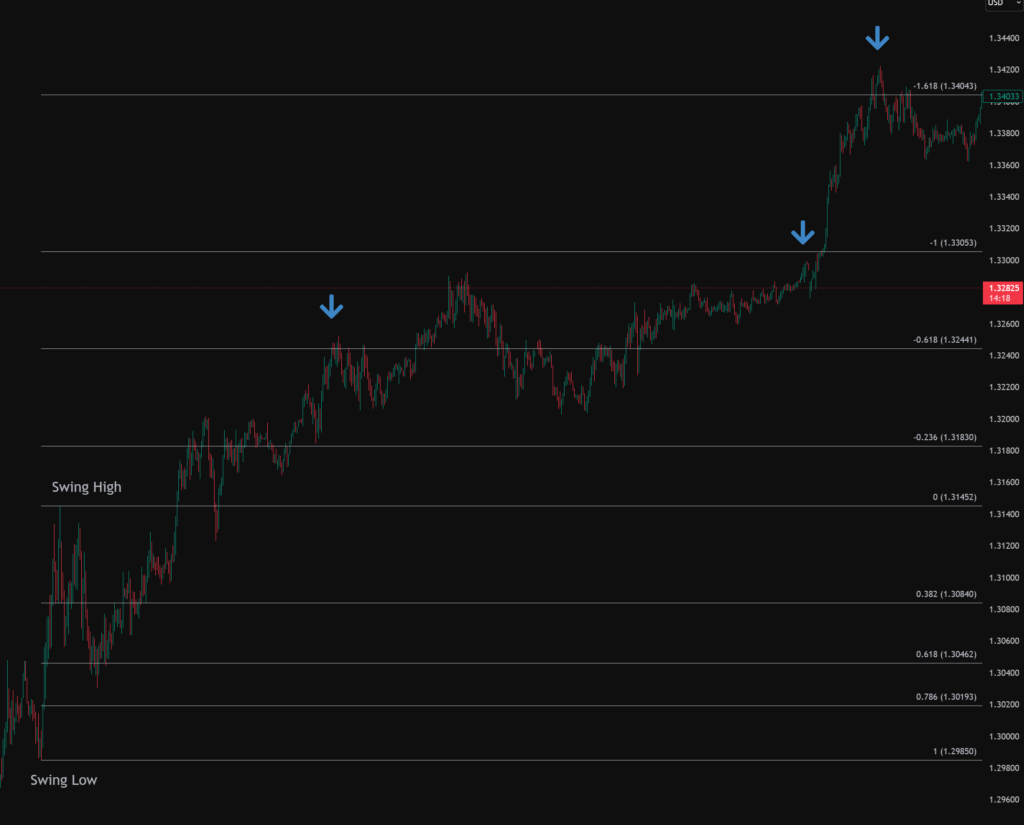
Fibonacci extension levels are used by traders to forecast potential price targets or areas of support and resistance beyond the initial 100% retracement level. The most frequently used Fibonacci extension levels include 100%, which represents a price movement equal in magnitude to the initial trend; 161.8%, often referred to as the “golden extension,” this level is a commonly watched profit target in strong trending markets; and 261.8%, another significant extension level used to project further price targets, particularly in extended moves. Other levels such as 127.2%, 138.2%, 200%, and 423.6% are also utilized by traders. Traders employ these levels to anticipate where a trend might continue after a temporary pullback or retracement has concluded. They serve as valuable tools for setting profit targets and identifying potential areas of resistance or support in extended market moves. Fibonacci extensions are typically drawn using three points on a price chart. In an uptrend, identify the initial swing low (Point A), the subsequent swing high (Point B), and the pullback low (Point C). Click on A, then B, then C to plot the extension levels. For a downtrend, identify the initial swing high (Point A), the subsequent swing low (Point B), and the pullback high (Point C). Click on A, then B, then C to plot the extension levels. The consistent emphasis on the 161.8% extension level as a significant target suggests its importance in trading strategies, likely due to its derivation from the golden ratio.
Its important to note, trading levels such as Fibonacci should be treated as zones rather than exact dollar targets.
Harnessing Fibonacci in Your Trading Strategy: Practical Applications
Traders frequently utilize Fibonacci retracement levels to pinpoint potential entry points when the price of an asset pulls back or retraces within an established trend. Instead of chasing the price as it moves in the trending direction, traders wait for a retracement to a key Fibonacci level, such as 38.2%, 50%, or 61.8%, to initiate a trade in the direction of the original trend. This strategy aims to secure a more favourable entry price with reduced risk. To increase the reliability of these entry signals, traders often look for confluence by combining Fibonacci retracement levels with other technical analysis tools, such as trend lines, the Relative Strength Index (RSI), or candlestick patterns. For example, if a price retraces to the 61.8% Fibonacci level and simultaneously shows an oversold reading on the RSI or forms a bullish reversal candlestick pattern, it can provide a stronger confirmation signal for a long entry.
Fibonacci extension levels are invaluable for traders looking to set realistic and data-driven profit targets. Once a trade is initiated in the direction of the trend following a retracement, Fibonacci extensions can help project potential price levels where the next significant move might encounter resistance or support. Common Fibonacci extension levels, such as 161.8% and 261.8%, are frequently monitored as potential take-profit zones. These levels represent extensions of the initial price move and can help traders avoid exiting their positions too early, allowing them to potentially capture more significant gains if the trend continues.
Effective risk management is paramount in trading, and Fibonacci levels can assist in determining strategic stop-loss placement. Traders often place their stop-loss orders just beyond the next Fibonacci retracement level. This approach aims to provide the trade with sufficient room to fluctuate naturally without being prematurely stopped out, while still limiting potential losses if the price unexpectedly reverses and breaks through the anticipated support or resistance level. For instance, if a trader enters a long position at the 38.2% Fibonacci retracement level, they might place their stop-loss order just below the 50% or 61.8% level. Some traders adopt a more conservative approach by placing their stop-loss orders beyond recent swing highs or swing lows. This strategy provides the trade with more room to breathe and reduces the likelihood of being stopped out by short-term volatility. However, it’s important to adjust position size accordingly to manage the increased risk associated with a wider stop-loss.
Before applying any Fibonacci tools, it is crucial to first identify the prevailing market trend. Fibonacci retracement and extension levels are most effective when applied within the context of a clear uptrend or downtrend. Traders often use price structure analysis, identifying higher highs and higher lows for an uptrend or lower highs and lower lows for a downtrend, or employ moving averages to determine the dominant trend direction. Applying Fibonacci tools without a clear understanding of the underlying trend can lead to less reliable signals. The versatility of Fibonacci levels in supporting various aspects of a trading strategy, from pinpointing entry opportunities to defining exit targets and managing risk, underscores their value in a trader’s toolkit.
Enhancing Fibonacci with Confluence: Combining with Other Technical Indicators
To increase the reliability and accuracy of Fibonacci levels, many traders look for confluence, which occurs when multiple technical analysis tools or patterns converge to suggest the same potential areas of support or resistance. When a Fibonacci level aligns with another significant technical indicator, it strengthens the case for a potential price reaction at that level. Trendlines, diagonal lines connecting a series of highs or lows, can be combined with Fibonacci retracement levels to identify high-probability trading setups. For instance, in an uptrend, a confluence of the 61.8% Fibonacci level and an ascending support trendline can signal a strong buying opportunity. Moving averages, which smooth price data, can also act as dynamic support or resistance. The alignment of key Fibonacci levels with popular moving averages like the 50-day or 200-day can create stronger zones of interest. Reversal candlestick patterns appearing at key Fibonacci levels can provide powerful confirmation signals for potential trend changes. Momentum oscillators like the RSI can further validate Fibonacci levels by identifying overbought or oversold conditions at potential reversal zones. Divergence between price and RSI at Fibonacci levels can also strengthen reversal signals. Similarly, MACD crossovers or divergences occurring near key Fibonacci levels can offer more robust trading signals. The practice of seeking confluence between Fibonacci levels and other technical indicators is a cornerstone of many successful trading strategies, as it provides a higher degree of confidence in potential trading opportunities.
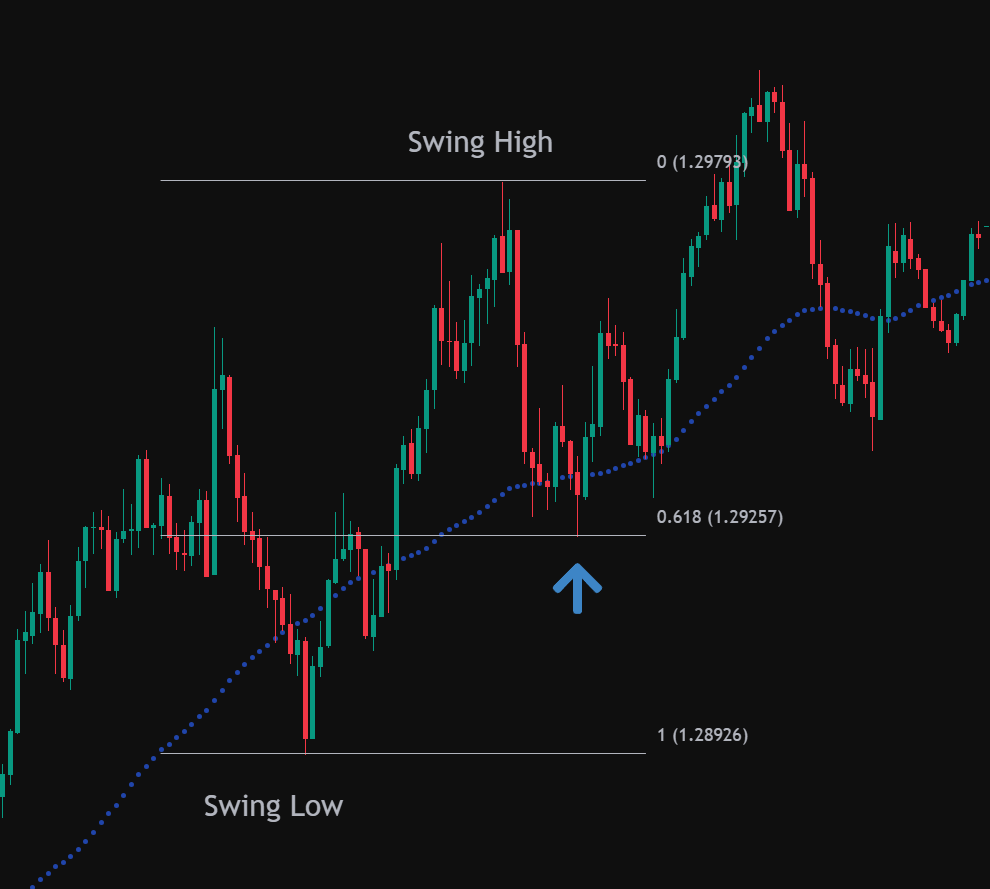
The below chart gives and example of a long entry on the GBP USD pair. The Blue dotted line is the 50 SMA (Simple Moving Average) on the 5m Chart. Price retraces to the 0.618 fib level which is in confluence with the 50sma which gives an added confluence to taking a long position.
Illustrative Examples: Fibonacci in Action Across Markets
Fibonacci levels find application across various financial markets. In stock trading, NVIDIA (NVDA) demonstrated a bounce from the 78.6% retracement after a significant climb, indicating a potential buying opportunity within an uptrend. DLF Limited saw its price retrace to the 61.8% level, aligning with support before continuing its upward trajectory, highlighting the golden ratio’s significance. The S&P 500 paused its post-election rally precisely at the 50% retracement, emphasizing the psychological importance of this level. Conversely, Halliburton (HAL) experienced a bounce in a downtrend that reached the 61.8% retracement, potentially confirming resistance for bearish traders. Even a shallower retracement level of 23.6% provided slight resistance for the S&P 500 after a low, showing the relevance of multiple Fibonacci levels.
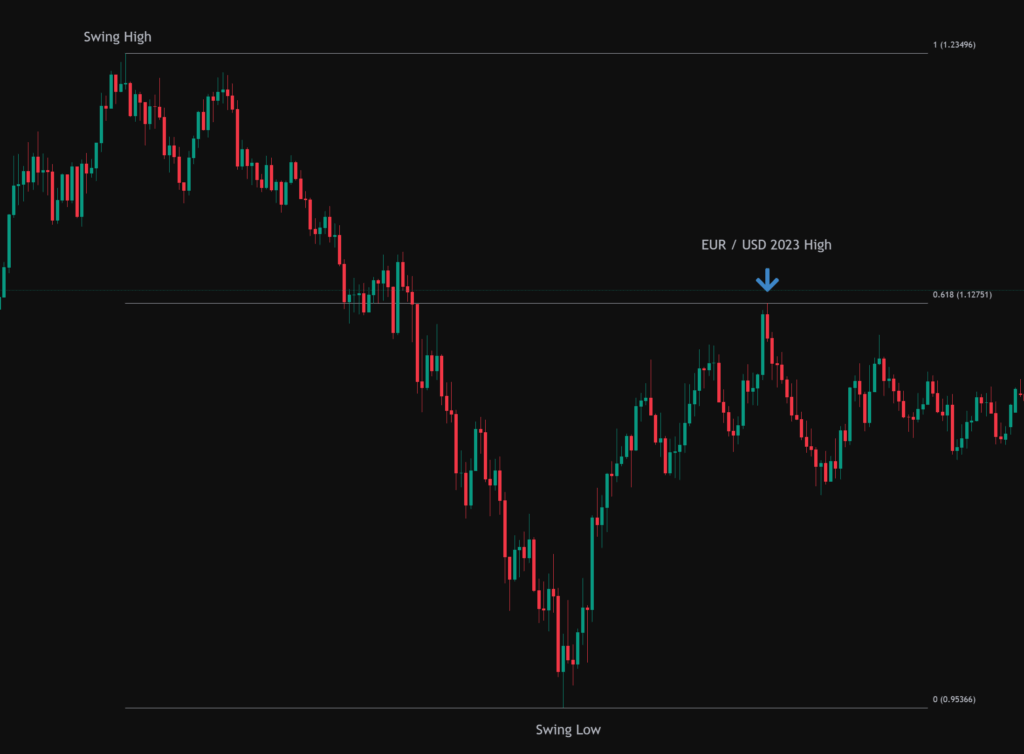
In forex, AUD/USD retraced to the 38.2% Fibonacci level during an uptrend, offering a profitable entry point. EUR/USD encountered resistance at the 38.2% and 50.0% levels during a downtrend bounce, signaling potential short entries. A trader used the 38.2% level in USD/CAD as a buy point and a stop-loss reference, illustrating practical application. The 2023 high in EUR/USD formed at the 61.8% retracement, showcasing the golden ratio’s role as resistance.
Cryptocurrency markets also exhibit reactions at Fibonacci levels. Bitcoin (BTC) showed potential support levels calculated at various Fibonacci retracements during a hypothetical pullback. Ethereum (ETH) stalling at the 61.8% level in an uptrend suggested a possible end to the retracement and a buying opportunity. Bitcoin found support at the 50% level after an upward move, indicating a potential continuation of the trend. Ethereum’s retracement to the “golden pocket” (between 61.8% and 65%) before further decline exemplifies the precision some traders attribute to these zones.
| Fibonacci Level | Common Use |
| 23.6% | Shallow pullback in strong trends |
| 38.2% | Moderate retracement, potential buy zone |
| 50% | Psychological midpoint, support/resistance |
| 61.8% | Golden ratio, key decision point |
| 78.6% | Deeper retracement, potential trend change |
| 100% | Full retracement, potential reversal |
| 161.8% | Primary extension target |
| 261.8% | Secondary extension target |
These examples across different asset classes highlight the widespread use and observed relevance of Fibonacci levels in trading.
Navigating the Limitations: Understanding the Criticisms of Fibonacci
While Fibonacci levels enjoy considerable popularity within the trading community, it is important to acknowledge their limitations and the criticisms leveled against them. One significant point of contention is the subjectivity involved in selecting the swing highs and lows used to draw the Fibonacci levels. Different traders may interpret charts slightly differently, leading to the placement of Fibonacci levels at varying price points. This subjectivity can make consistent and objective analysis challenging.
Furthermore, Fibonacci levels do not possess guaranteed predictive power. While they can highlight potential areas of support and resistance, price action can often break through these levels without any significant reaction, especially during periods of high volatility or in response to major news events. The argument that Fibonacci levels can become self-fulfilling prophecies due to their widespread use also merits consideration. The mere fact that many traders are observing and acting upon these levels might contribute to price reactions at those points, rather than an inherent mathematical property of the market.
The effectiveness of Fibonacci levels is often dependent on the prevailing market conditions. They tend to work best in clearly trending markets, while their reliability can diminish in choppy or range-bound environments. Traders should also be aware of the potential for false signals, where the price might briefly respect a Fibonacci level before reversing direction. Critics from the academic community sometimes view the application of Fibonacci ratios in finance with skepticism, suggesting it lacks rigorous scientific backing. Some studies have even indicated that retracements to common Fibonacci levels might not be statistically more significant than retracements to other arbitrary percentages. Furthermore, the application of Fibonacci retracements on very short timeframes can be less effective due to the increased noise and volatility inherent in such charts. These limitations highlight the importance of using Fibonacci levels as part of a broader trading strategy that incorporates other forms of technical analysis and risk management.
Conclusion: Embracing Fibonacci as a Valuable Tool
Fibonacci levels, with their roots in a fascinating mathematical sequence and the elegant golden ratio, offer traders a unique lens through which to analyse potential turning points in the market. While they offer valuable insights into potential support and resistance levels and can be helpful in setting entry and exit points, profit targets, and stop-loss orders, it’s crucial to recognise that they are not infallible. To maximise their effectiveness, traders should strive to use Fibonacci levels in conjunction with other technical analysis tools, such as trendlines, moving averages, candlestick patterns, and momentum oscillators, to look for confluence and increase the probability of successful trades. By understanding both the potential benefits and the inherent limitations of Fibonacci levels, traders can integrate them thoughtfully into their overall trading strategies, enhancing their analytical capabilities and improving their decision-making process in the dynamic world of financial markets. Remember that consistent practice and a nuanced understanding of market context are key to harnessing the power of Fibonacci levels effectively.