
Yesterday’s Footprints: Previous Day High, Low, and Equilibrium
Ever feel like the market is speaking a language you haven’t quite deciphered? You pore over charts, analyse indicators, and still feel like you’re missing a crucial piece of the puzzle. Well, what if I told you that some of the most valuable clues lie in the simple yet powerful footprints left behind by the previous trading day? I’m talking about the Previous Day High (PDH), Previous Day Low (PDL), and the often-overlooked Previous Day Equilibrium (PDEQ).
Forget complex algorithms for a moment. These levels offer a raw, unfiltered glimpse into the market’s recent activity, providing key reference points that can significantly enhance your trading strategy. Let’s break them down:
The High and the Low: Boundaries of Yesterday’s Battle
Think of the Previous Day High (PDH) as the peak of bullish enthusiasm from the prior session. It represents the highest price buyers were willing to push the asset to. Conversely, the Previous Day Low (PDL) marks the lowest point of bearish sentiment, the level where sellers found the most resistance or buyers stepped in aggressively.
These aren’t just arbitrary points on a chart. They represent significant psychological levels. Why? Because traders remember. Participants who missed out on selling at the high might be looking for another opportunity. Buyers who saw the price bounce off the low might be eager to jump in again if it revisits that level.
The Equilibrium: Finding the Fair Price
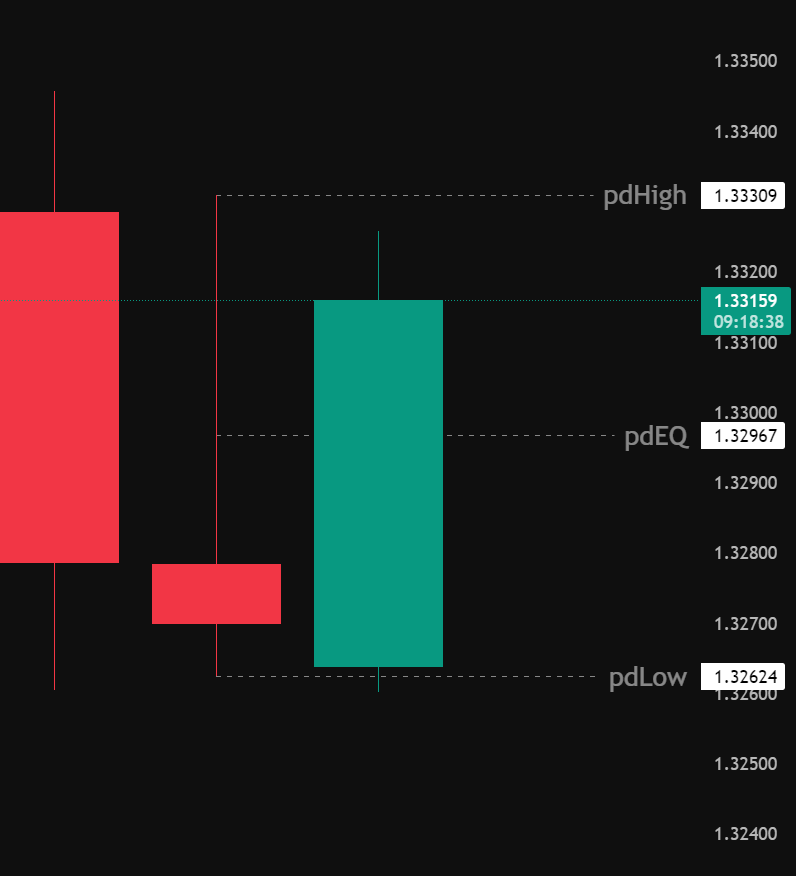
While the high and low define the extremes, the Previous Day Equilibrium (PDEQ) represents the area where buying and selling forces found a temporary balance. There isn’t one universally agreed-upon method to calculate this, but common approaches include:
- Midpoint: Simply 50% of the High and Low of the previous day.
- Volume Weighted Average Price (VWAP) of the Previous Day: This considers both price and volume, offering a more nuanced view of where the majority of trading activity occurred.
- Point of Control (POC) of the Previous Day: This is the price level with the highest traded volume during the previous session.
The equilibrium acts as a magnet. Price often gravitates towards it, especially at the start of a new trading day. It can serve as a key area for potential reversals, breakouts, or consolidation.
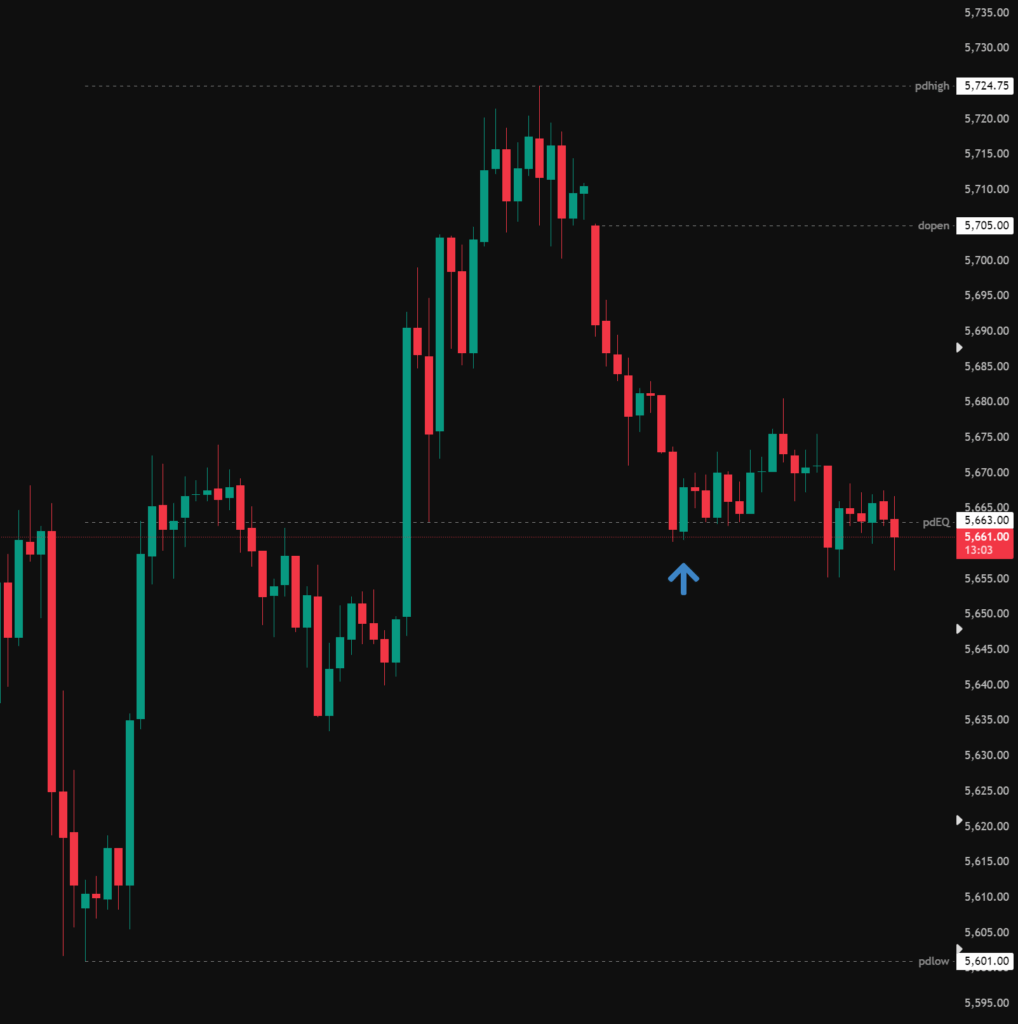
The below chart is a 30m Chart from the ES, we can see the pdHigh was 5,724.75, pdLow was 5,601.00 making the pdEQ 5,663. Price opened at 5,705 and retraced to the pdEQ where we saw a reaction.
Putting it All Together: Crafting a Strategy
Now for the exciting part: how can these “yesterday’s footprints” inform your trading decisions today? Here are a few ideas to get you started:
- Breakout Trading: Watch for price to break above the PDH or below the PDL with strong momentum. This can signal the continuation of a trend or the start of a new one. Consider entering long on a break of the PDH with a stop-loss below it, or short on a break of the PDL with a stop-loss above it.
- Reversal Trading: If price approaches the PDH or PDL and shows signs of rejection (e.g., candlestick patterns like dojis or engulfing bars), it could signal a potential reversal. You might consider entering short near the PDH with a stop-loss above it, or long near the PDL with a stop-loss below it.
- Equilibrium as a Pivot: Observe how price interacts with the previous day’s equilibrium. A break above it could suggest bullish momentum, while a break below it might indicate bearish pressure. You could also look for consolidation around the equilibrium, followed by a breakout in either direction.
- Combining with Other Tools: These levels are even more powerful when used in conjunction with other technical analysis tools like Fibonacci retracements, trend lines, and support/resistance levels. For instance, if a key Fibonacci level coincides with the PDL, it adds confluence to a potential reversal trade.
Important Considerations:
- Market Context: The significance of PDH, PDL, and equilibrium can vary depending on the overall market conditions and the specific asset you’re trading. Volatile markets might see these levels broken more frequently.
- Timeframe: While we’re focusing on the previous day, you can apply the same concept to previous weeks or even shorter timeframes depending on your trading style.
- Not a Holy Grail: These levels are powerful tools, but they are not foolproof. Always use proper risk management and never rely solely on these levels for your trading decisions.
In Conclusion:
The previous day’s high, low, and equilibrium offer a valuable framework for understanding market dynamics and identifying potential trading opportunities. By paying attention to these simple yet significant levels, you can gain a fresh perspective on price action and develop more informed and robust trading strategies. So, the next time you sit down to trade, take a good look at yesterday’s footprints – they might just lead you to your next successful trade.