
For anyone navigating the dynamic world of trading, understanding the ebb and flow of asset prices is paramount. At the heart of this understanding lie the fundamental concepts of support and resistance levels. These levels represent key junctures on a price chart where the forces of buying and selling converge, often dictating the future trajectory of an asset. Support can be visualised as a price floor, a level below which the price tends to struggle to fall. Conversely, resistance acts as a price ceiling, a level above which the price often encounters difficulty in rising. Grasping these concepts is not merely academic; it is an essential skill for any trader aiming to make informed decisions and develop effective trading strategies.
What are Support and Resistance Levels?
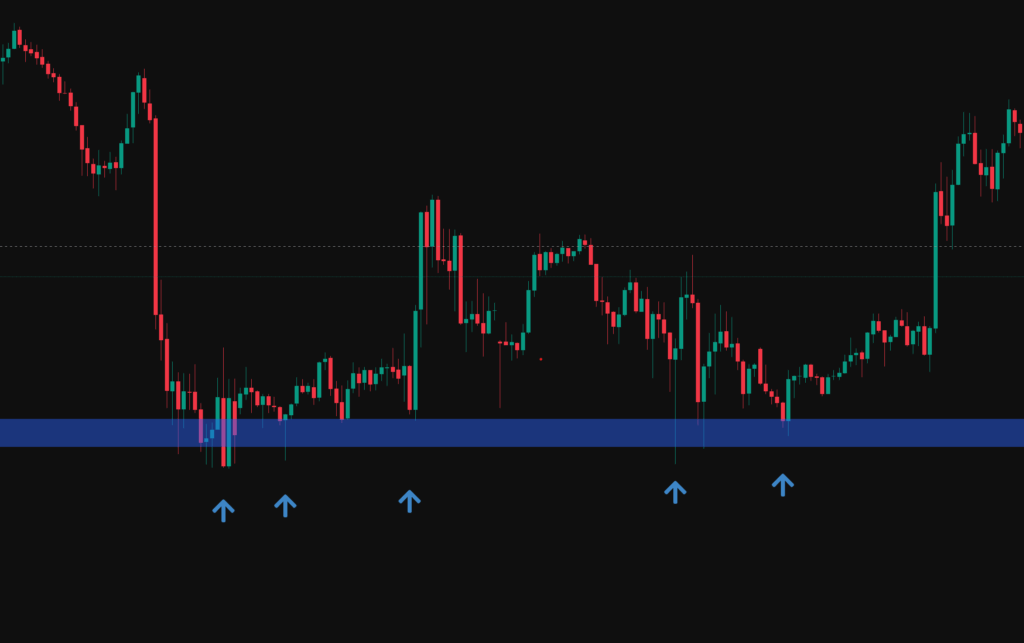
In the realm of trading, the term “support” refers to a specific price level on a chart where the buying interest is substantial enough to counteract selling pressure, thereby preventing the price from declining further. This level can be thought of as a “floor” that the price tends to bounce off. At these junctures, the demand for the asset typically exceeds the supply, leading to a halt in the price descent and a potential reversal. When a price approaches a support level multiple times and rebounds, it often signifies a strong psychological belief among buyers that the asset is undervalued at that price, encouraging them to step in and purchase it. This repeated buying action reinforces the support level. It’s important to note that support is not always a precise price point; it can also manifest as a broader price zone where buying interest is concentrated.
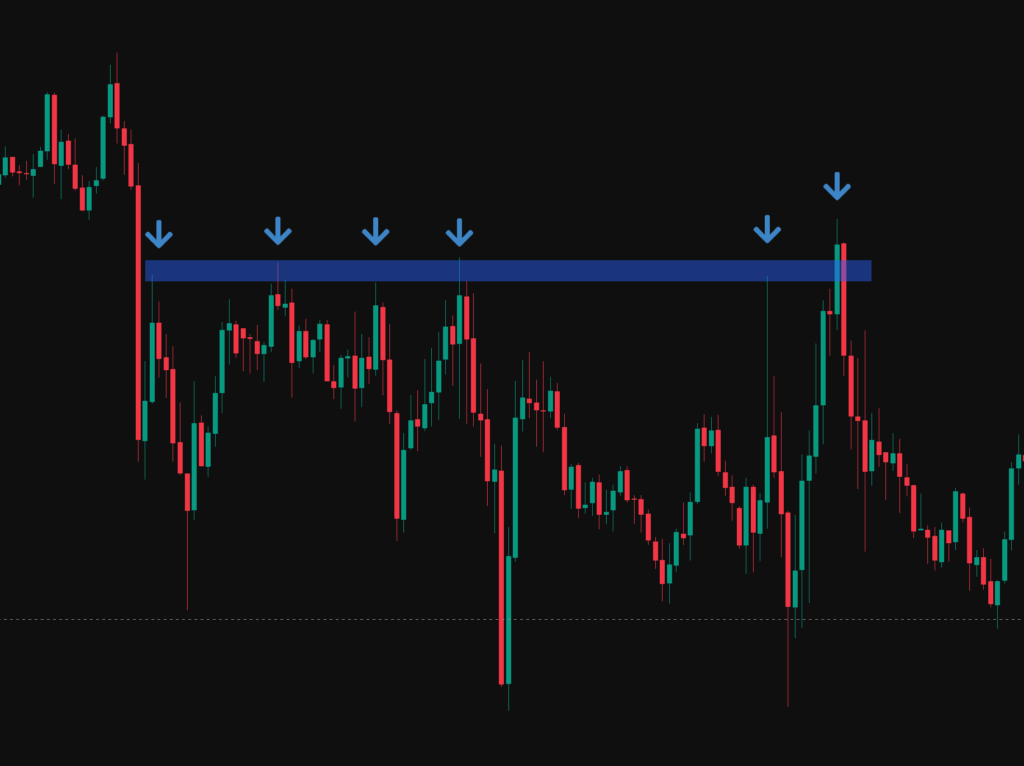
Conversely, resistance in trading describes a price level where the selling pressure is potent enough to impede further upward movement of the price. This level operates as a “ceiling,” hindering the price from moving higher. At resistance, the supply of the asset tends to outweigh the demand, causing the price to stall and potentially reverse its upward trajectory. Similar to support, when a price repeatedly attempts to breach a resistance level but fails, it strengthens the significance of that level. This indicates a psychological barrier where sellers are likely to enter the market, believing the asset is overvalued. Resistance can also be defined as either a specific price level or a broader zone.
It is crucial to understand that support and resistance levels are not static barriers that remain unchanged forever. Market dynamics are constantly evolving, influenced by a multitude of factors, and consequently, the balance between supply and demand at any given price level can shift over time.
Identifying Key Support and Resistance Levels:
Traders employ various techniques to pinpoint potential support and resistance levels on price charts. One of the most fundamental approaches involves analysing historical price action, specifically looking at swing highs and lows. Significant peaks, known as swing highs, often indicate areas where selling pressure previously overwhelmed buying interest, thus representing potential future resistance. Conversely, significant troughs, or swing lows, suggest levels where buying interest was strong enough to halt a decline, indicating potential future support. The more frequently the price has reversed direction at a particular historical level, the greater the likelihood that this level will act as a significant barrier in the future. This repeated interaction with a price level builds a collective expectation among traders, increasing the chances of a similar reaction upon its revisit.
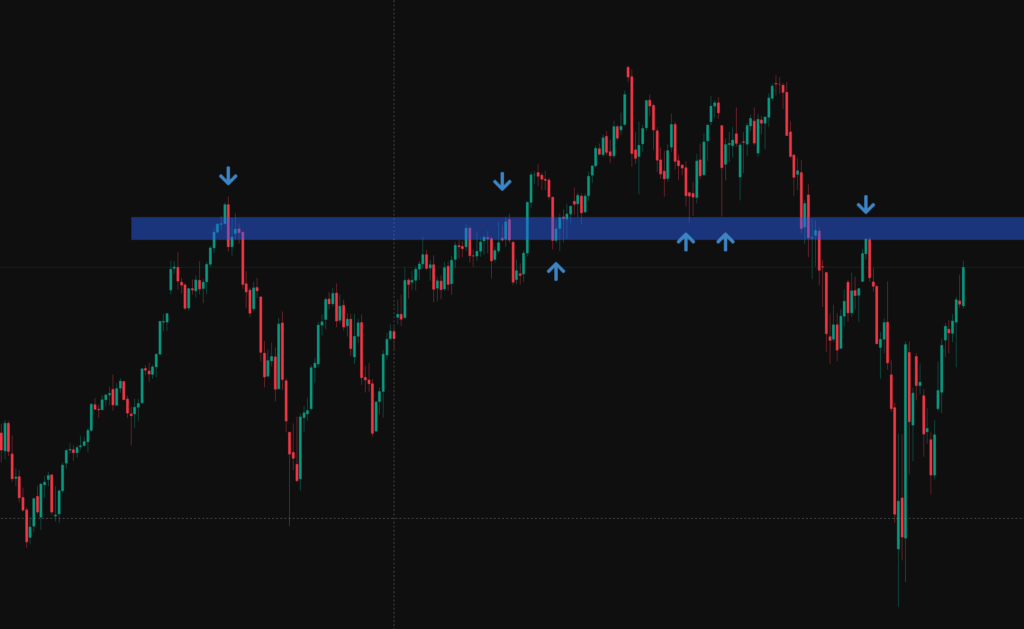
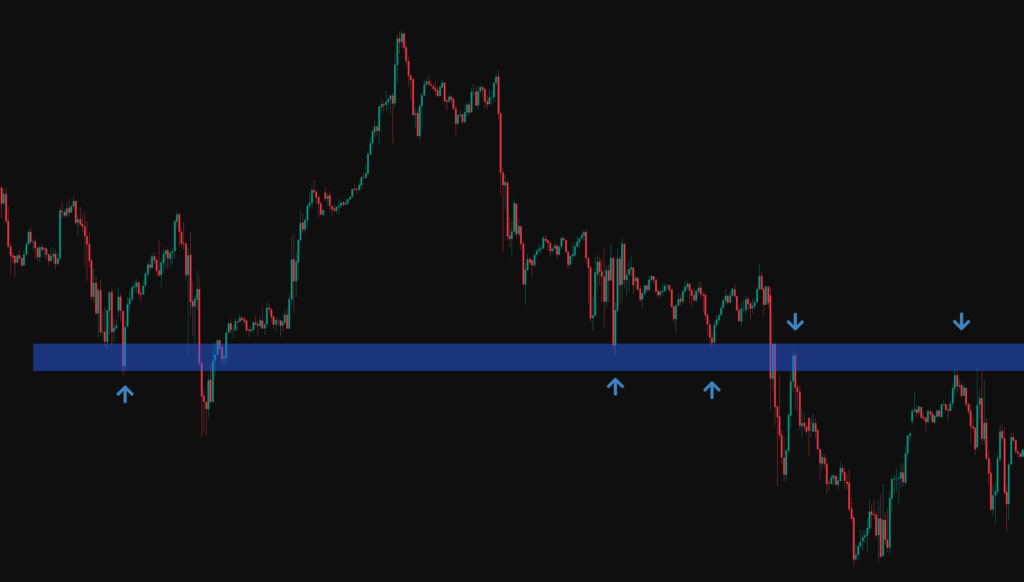
The below chart shows and example of support and resistance on the Nasdaq, here we can clearly see a zone acting as resistance, flipping to support and then back to resistance. This chart is showing the daily time frame where each candle represents 1 day of price action.
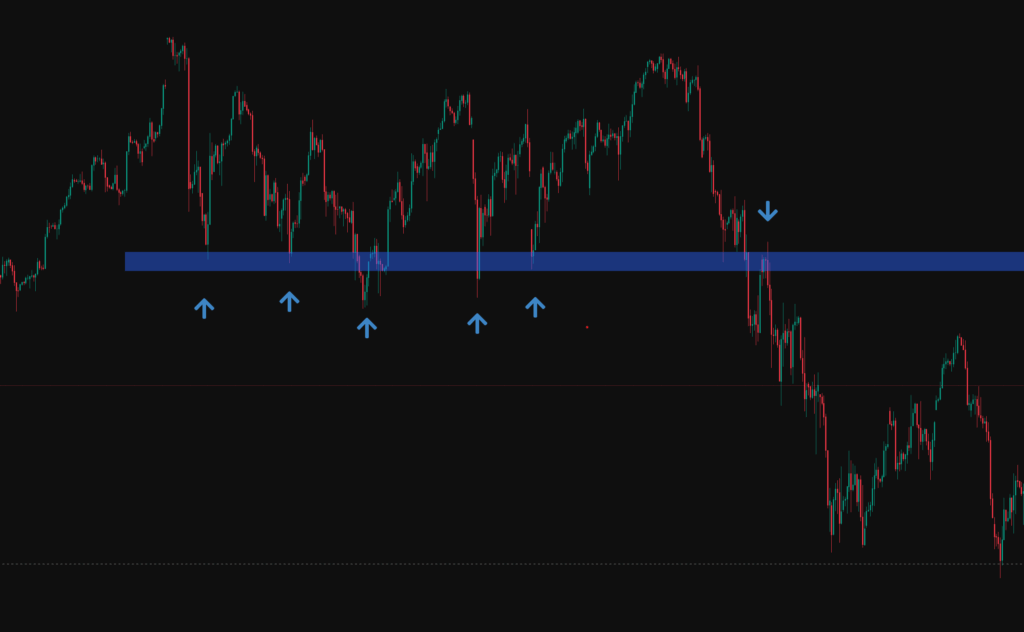
The below chart is a 4 hour chart on the Nasdaq, again its clear to see the zone of support eventually being flipped to resistance.
Another valuable method for identifying support and resistance involves drawing trendlines. In an uptrend, an ascending trendline is created by connecting a series of higher lows, representing a dynamic support level. Conversely, in a downtrend, a descending trendline connects a series of lower highs, indicating a dynamic resistance level. These trendlines visually depict the momentum of the prevailing trend. Unlike static horizontal levels, trendlines offer dynamic support and resistance because they adapt to the ongoing price action, making them particularly useful in markets exhibiting a clear trend. As long as the price respects the trendline by bouncing off it, it suggests that the underlying buying or selling pressure driving the trend remains dominant.
Moving averages (MAs) also serve as valuable dynamic support and resistance levels. Common moving averages, such as the 50-day and 200-day MAs, are widely followed by traders. Different timeframes of moving averages can represent varying degrees of support and resistance, with longer-term MAs generally indicating stronger levels. Shorter-term moving averages tend to react more quickly to recent price changes and can act as minor support or resistance, while longer-term moving averages, which average prices over a more extended period, reflect broader market sentiment and therefore often present more significant barriers.
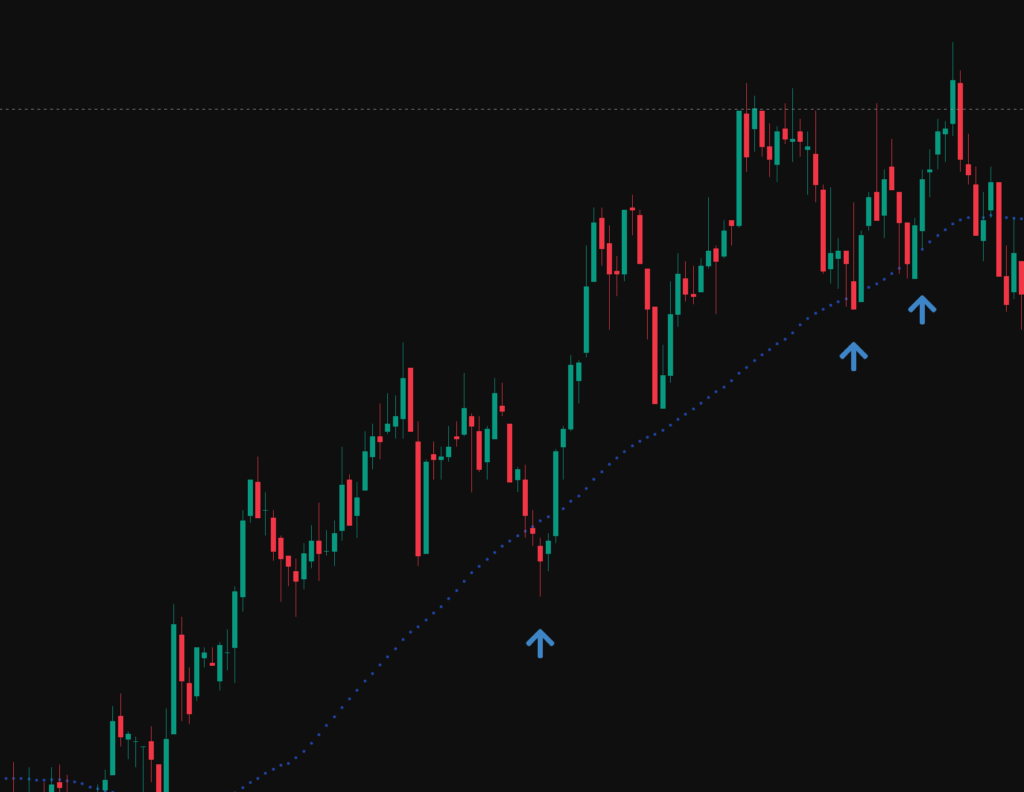
The below image shows the 50 SMA (Simple Moving Average) plotted on a 1 minute chart on the Nasdaq. This chart shows around 1 hour of price action on a trending market which gave 3 entry triggers.
For short-term trading perspectives, pivot points can be instrumental in identifying potential support and resistance levels for the current trading day. These points are calculated using the high, low, and closing prices from the previous trading period. Pivot points offer objective and predefined support and resistance levels, making them particularly useful for day traders seeking short-term trading opportunities. By using a standardised calculation based on the prior day’s price action, pivot points provide traders with clear levels to monitor for potential price reversals or breakouts at the beginning of the new trading session.
Fibonacci retracement levels offer another technique for identifying potential support and resistance. These levels are derived from the Fibonacci sequence and are often used to forecast where price movements might pause or reverse. Key Fibonacci ratios such as 38.2%, 50%, 61.8%, 66%, 0.75% and 0.786% are commonly watched. The significance of Fibonacci retracement levels is amplified when they align with other support and resistance indicators, increasing the probability of a price reaction at those areas. This convergence of multiple technical analysis tools at a specific price area creates a zone of confluence, suggesting a higher likelihood that the price will respect that level.
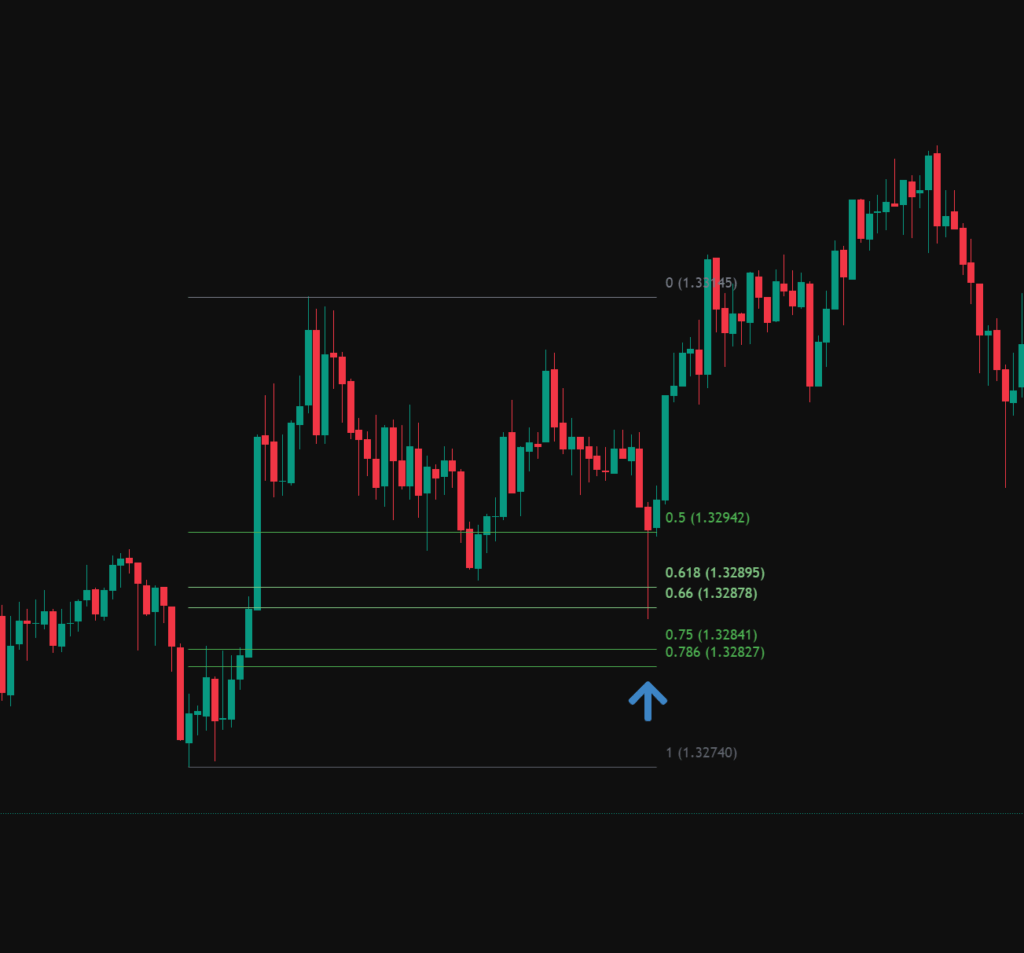
The below chart gives an example of the GBP/USD pulling back to the 0.66% Fibonacci level before making a new high.
Psychological levels, particularly round numbers like $10, $50, or $100, frequently act as support and resistance. Traders tend to place buy or sell orders around these easily remembered prices. Halfway points such as $5, $25, or $75 can also hold psychological significance. The collective behaviour of traders reacting to these psychological levels can lead to self-fulfilling prophecies, resulting in price bounces or reversals. Because many traders anticipate reactions at round numbers, they place orders around these levels, and this concentration of orders can indeed cause the price to stall or reverse when it approaches these points.
Finally, Price by Volume (PBV) charts offer another method for identifying potential support and resistance levels. These charts illustrate the volume of trading activity at different price levels, highlighting areas of significant buying or selling interest. Longer volume bars on a PBV chart indicate price levels where a substantial number of shares or contracts have been traded, suggesting stronger potential for support or resistance.
How Support and Resistance Enhance Your Trading Strategy:
Understanding support and resistance levels can significantly enhance a trader’s strategic decision-making. These levels serve as crucial reference points for identifying potential entry and exit points for trades. Traders often look to initiate long (buy) positions when the price of an asset approaches a support level, anticipating a rebound. Conversely, they may consider entering short (sell) positions when the price nears a resistance level, expecting a downward reversal. Furthermore, these levels can guide traders in determining when to exit their positions to realize profits.
Support and resistance levels also play a crucial role in confirming the direction of a prevailing trend. In an uptrend, the price typically makes higher lows, with previous resistance levels often turning into new support. Conversely, in a downtrend, the price tends to make lower highs, with former support levels potentially becoming new resistance. A decisive break above a significant resistance level can signal the beginning of a new uptrend, while a break below a key support level may indicate the start of a downtrend.
Furthermore, support and resistance levels are invaluable for setting strategic stop-loss orders. When initiating a long position, traders often place their stop-loss order just below a recognized support level. This is based on the rationale that if the price unexpectedly breaks below this support, the initial premise for the long trade is likely invalidated, and it’s prudent to limit potential losses. Conversely, when taking a short position, a stop-loss order is typically placed just above a resistance level. It’s often advisable to position these stop-loss orders slightly beyond the exact support or resistance levels to avoid being prematurely exited from a trade due to minor price fluctuations or what are sometimes referred to as “overshoots” and “undershoots”. Since support and resistance can sometimes act as zones rather than precise lines, a stop-loss placed exactly at the level might be triggered unnecessarily by normal market volatility.
Similarly, support and resistance levels are crucial for establishing profitable take-profit targets. When in a long trade, a trader might set a take-profit order near the next significant resistance level, anticipating that the price will encounter selling pressure at that point. Conversely, in a short trade, the take-profit order could be placed near the next significant support level, where buying interest might cause the price to rebound. Identifying multiple levels of support and resistance can also enable traders to implement staged take-profit strategies, allowing them to secure partial profits as the price approaches intermediate levels before potentially reaching their ultimate target. This approach acknowledges that the market may not always move directly to the intended profit target and allows for capturing gains along the way.
Trading Strategies Based on Support and Resistance:
Several popular trading strategies are built upon the principles of support and resistance. One common approach is the “bounce” strategy. This involves buying an asset when its price declines towards a support level, anticipating that the buying pressure will cause it to bounce back up. Conversely, traders using this strategy may sell an asset when its price rallies towards a resistance level, expecting selling pressure to push it back down. It is often prudent to wait for confirmation of a bounce, such as specific candlestick patterns or other technical signals, before entering a trade based on this strategy.
Another widely used strategy is the “breakout” strategy. This strategy involves entering a long position when the price decisively breaks above a resistance level, suggesting that the buying pressure has overcome the selling pressure and the price is likely to continue rising. Conversely, a short position is taken when the price breaks below a support level, indicating strong selling pressure and a potential further decline. It is crucial to look for increased trading volume to confirm the validity of a breakout.
A variation of the breakout strategy is the “retest” strategy. After a price breaks through a significant support or resistance level, it may subsequently retrace back to test that broken level. This former level can then act as a new resistance (if support was broken) or a new support (if resistance was broken), providing a potential entry point in the direction of the initial breakout. This approach can be considered more conservative than directly trading the breakout.
The below image is a 5m chart taken from the Nasdaq, here we can see a resistance level being tested several times before the price broke through, made a clear market structure shift with a higher high and then a retracement back to the area of resistance which clearly flipped to support.
The Fascinating Role Reversal:
One of the intriguing aspects of support and resistance is the phenomenon of role reversal. When a significant support level is decisively broken, indicating strong selling pressure, that same price level can often act as a resistance level in the future. Conversely, when a robust resistance level is overcome, suggesting strong buying interest, that level may then function as a support level on subsequent price declines. This reversal of roles reflects a fundamental shift in the supply and demand dynamics at that particular price. For instance, if a stock price has been repeatedly rejected at a resistance level of $50, but then breaks through it with strong volume, on any subsequent pullback towards $50, traders might expect to see buying interest emerge, turning the former resistance into a new support level. Recognising this phenomenon can provide valuable clues about the sustainability of a breakout and potential future price movements. When a significant resistance is broken and the price starts using it as support on a pullback, it suggests that the buying pressure is strong and the breakout is likely to be sustained. Conversely, a broken support level acting as resistance indicates continued selling pressure.
Support and Resistance Zones:
While support and resistance are often discussed as specific price levels, it is more accurate to view them as zones or areas on a price chart. This is because market activity is rarely precise, and buying or selling interest may be concentrated within a small range of prices rather than at a single point. Considering these zones can help traders filter out potential false breakouts or bounces that might occur just above or below a specific price point. By identifying a small range around a potential support or resistance level, traders account for the natural fluctuations in buying and selling pressure, providing a more realistic view of where price reversals are likely to occur.
Combining Support and Resistance with Other Technical Indicators:
To increase the reliability of trading signals, many traders combine their analysis of support and resistance levels with other technical indicators. This approach, known as confluence, involves looking for multiple indicators to confirm a potential trading opportunity. For example, moving averages can be used to confirm the overall trend and identify dynamic support or resistance levels. If the price bounces off a moving average near a static support or resistance level, it can strengthen the trading signal. The Relative Strength Index (RSI) can help identify overbought or oversold conditions near support and resistance levels, potentially signalling impending reversals. A divergence between the price action and the RSI near a support or resistance level can be a particularly strong indication of a potential reversal. The Moving Average Convergence Divergence (MACD) indicator can also be used to confirm trend strength and potential reversals at these key price levels. Analysing trading volume can further validate price movements at support and resistance. High volume on a breakout above resistance or below support can confirm the strength of the move, while low volume on a bounce might suggest a lack of conviction. Finally, Fibonacci retracement levels can identify potential support and resistance areas that align with previously identified levels, creating zones of confluence.
Combining indicators from different categories can provide a more comprehensive view of market conditions and increase the reliability of trading signals. Relying on a single indicator can be misleading, as different indicators measure different aspects of price action. By using a mix of trend, momentum, and volume indicators in conjunction with support and resistance levels, traders can filter out noise and gain stronger confirmation for their trading decisions.
| Indicator 1 | Indicator 2 | How it complements Support/Resistance |
| Moving Average | Support/Resistance | Confirms the overall trend and can act as dynamic support/resistance. Price bouncing off MA near a static S/R level strengthens the signal. |
| RSI | Support/Resistance | Identifies overbought/oversold conditions near S/R levels, suggesting potential reversals. Divergence between price and RSI at S/R levels is a strong signal. |
| Volume | Support/Resistance | High volume on a breakout above resistance or below support confirms the strength of the move. Low volume on a bounce might suggest weakness. |
| Fibonacci Retracement | Support/Resistance | Fibonacci levels often align with historical support and resistance, creating zones of confluence. |
Understanding the Psychology Behind the Levels:
It is important to recognise that support and resistance levels are not merely arbitrary lines drawn on a chart; they reflect the collective psychology of the market participants. Emotions such as fear and greed play a significant role in shaping trader behaviour around these levels. For instance, when a price approaches a resistance level, traders who previously missed an opportunity to sell at a higher price might feel compelled to initiate short positions, fearing they will miss out on a potential decline. Conversely, at support levels, the fear of missing out on a perceived buying opportunity can drive demand. The concept of “herd mentality” also contributes to the respect of these levels. If a large number of traders believe that a certain price level will act as support or resistance, their collective actions of placing buy or sell orders around that level can indeed cause the price to react as anticipated, creating a self-fulfilling prophecy. Psychological levels, especially round numbers, gain significance simply because many traders are watching them and making trading decisions based on these easily recognizable price points.
Limitations and What to Watch Out For:
While support and resistance levels are powerful tools, it is important to acknowledge their limitations. The identification of these levels can be subjective, with different traders potentially drawing them at slightly different price points. Additionally, markets can experience false breakouts, where the price briefly moves beyond a support or resistance level but then quickly reverses direction. It is crucial to understand that these levels are not impenetrable barriers and can be broken, especially during periods of high market volatility or following significant news announcements. Therefore, it is generally not advisable to rely solely on support and resistance levels for making trading decisions. Furthermore, the more times a support or resistance level is tested without being broken, the weaker it may become, as the underlying buying or selling pressure at that level might eventually be exhausted. Each successful defence of a level consumes some of the available buying or selling interest, making the level more vulnerable to a future breakout.
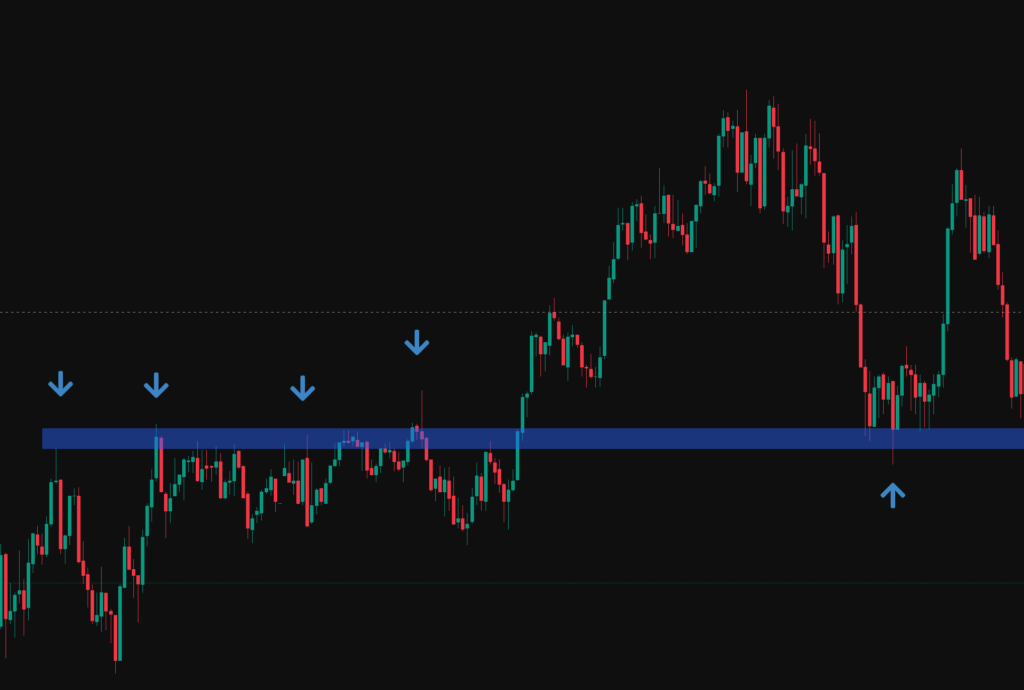
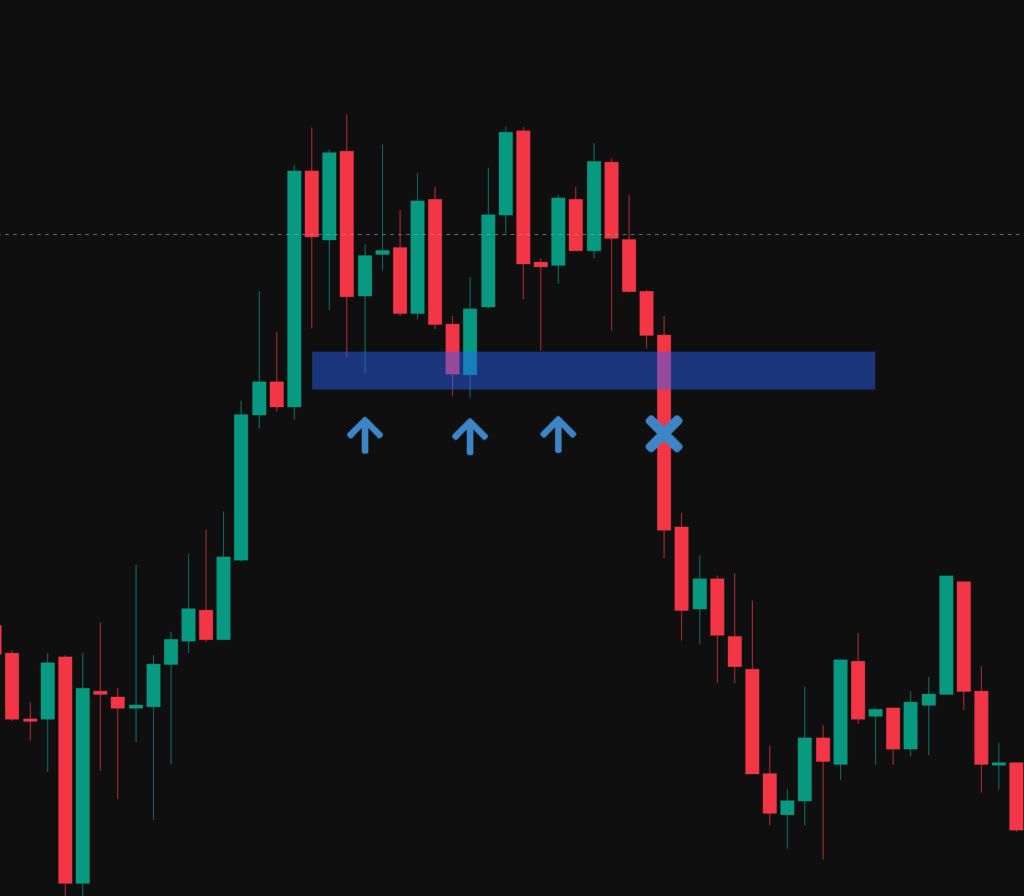
The below image shows an example of when a support level no long acts as support with a clear break of the level. This highlights why you need an entry trigger and clear invalidation before taking any trade on any financial market.
Conclusion:
Support and resistance levels are foundational concepts in technical analysis, providing traders with valuable insights into potential price barriers and likely areas for price reversals. By understanding what these levels represent, how to identify them using various techniques, and how they can be incorporated into different trading strategies, traders can significantly enhance their ability to make informed decisions. The concepts of role reversal and support and resistance zones further refine this understanding, offering a more nuanced perspective on market dynamics. While powerful, support and resistance should not be used in isolation. Combining them with other technical indicators can provide stronger confluence and increase the probability of successful trades. Ultimately, mastering the use of support and resistance requires practice, continuous learning, and an awareness of their limitations within the broader context of market behavior.